Service Weaver is a programming framework for writing, deploying, and managing distributed applications. You can run, test, and debug a Service Weaver application locally on your machine, and then deploy the application to the cloud with a single command.
$ go run .                       # Run locally.
$ weaver ssh deploy weaver.toml  # Run on multiple machines.
$ weaver gke deploy weaver.toml  # Run on Google Cloud.
$ weaver kube deploy weaver.toml # Run on Kubernetes.
A Service Weaver application is composed of a number of components. A component is represented as a regular Go interface, and components interact with each other by calling the methods defined by these interfaces. This makes writing Service Weaver applications easy. You don't have to write any networking or serialization code; you just write Go. Service Weaver also provides libraries for logging, metrics, tracing, routing, testing, and more.
You can deploy a Service Weaver application as easily as running a single command. Under the covers, Service Weaver will dissect your binary along component boundaries, allowing different components to run on different machines. Service Weaver will replicate, autoscale, and co-locate these distributed components for you. It will also manage all the networking details on your behalf, ensuring that different components can communicate with each other and that clients can communicate with your application.
Refer to the Installation section to install Service Weaver on your machine, or read the Step by Step Tutorial section for a tutorial on how to write Service Weaver applications.
Ensure you have Go installed, version 1.21 or higher. Then, run
the following to install the weaver command:
$ go install github.com/ServiceWeaver/weaver/cmd/weaver@latest
go install installs the weaver command to $GOBIN, which defaults to
$HOME/go/bin. Make sure this directory is included in your PATH. You can
accomplish this, for example, by adding the following to your .bashrc and
running source ~/.bashrc:
$ export PATH="$PATH:$HOME/go/bin"
If the installation was successful, you should be able to run weaver --help:
$ weaver --help
USAGE

  weaver generate                 // weaver code generator
  weaver version                  // show weaver version
  weaver single    <command> ...  // for single process deployments
  weaver multi     <command> ...  // for multiprocess deployments
  weaver ssh       <command> ...  // for multimachine deployments
  ...
Note: For cloud deployments you should also install the weaver gke or
weaver kube command (see the GKE, Kube sections for details):
$ go install github.com/ServiceWeaver/weaver-gke/cmd/weaver-gke@latest
$ go install github.com/ServiceWeaver/weaver-kube/cmd/weaver-kube@latest
Note: If you run into issues installing weaver, weaver gke or weaver kube
commands on macOS, you may want to prefix the install command with
export CGO_ENABLED=1; export CC=gcc.
For example:
$ export CGO_ENABLED=1; export CC=gcc; go install github.com/ServiceWeaver/weaver/cmd/weaver@latest
In this section, we show you how to write Service Weaver applications. To install Service Weaver and follow along, refer to the Installation section. The full source code presented in this tutorial can be found here.
Service Weaver's core abstraction is the component. A component is like an actor, and a Service Weaver application is implemented as a set of components. Concretely, a component is represented with a regular Go interface, and components interact with each other by calling the methods defined by these interfaces.
In this section, we'll define a simple hello component that just prints
a string and returns. First, run go mod init hello to create a go module.
$ mkdir hello/
$ cd hello/
$ go mod init hello
Then, create a file called main.go with the following contents:
package main

import (
    "context"
    "fmt"
    "log"

    "github.com/ServiceWeaver/weaver"
)

func main() {
    if err := weaver.Run(context.Background(), serve); err != nil {
        log.Fatal(err)
    }
}

// app is the main component of the application. weaver.Run creates
// it and passes it to serve.
type app struct{
    weaver.Implements[weaver.Main]
}

// serve is called by weaver.Run and contains the body of the application.
func serve(context.Context, *app) error {
    fmt.Println("Hello")
    return nil
}
weaver.Run(...) initializes and runs the Service Weaver application. In
particular, weaver.Run finds the main component, creates it, and passes it to
a supplied function. In this example,app is the main component since it
contains a weaver.Implements[weaver.Main] field.
Before we build and run the app, we need to run Service Weaver's code generator,
called weaver generate. weaver generate writes a weaver_gen.go file that
contains code needed by the Service Weaver runtime. We'll elaborate on what
exactly weaver generate does and why we need to run it later. Finally, run the
app!
$ go mod tidy
$ weaver generate .
$ go run .
Hello
Components are the core abstraction of Service Weaver. All code in a Service Weaver application runs as part of some component. The main advantage of components is that they decouple how you write your code from how you run your code. They let you write your application as a monolith, but when you go to run your code, you can run components in a separate process or on a different machine entirely. Here's a diagram illustrating this concept:

When we go run a Service Weaver application, all components run together in a
single process, and method calls between components are executed as regular Go
method calls. In a moment, we'll describe how to run each component in a
separate process with method calls between components executed as RPCs.
In a Service Weaver application, any component can call any other component. To
demonstrate this, we introduce a second Reverser component. Create a file
reverser.go with the following contents:
package main

import (
    "context"

    "github.com/ServiceWeaver/weaver"
)

// Reverser component.
type Reverser interface {
    Reverse(context.Context, string) (string, error)
}

// Implementation of the Reverser component.
type reverser struct{
    weaver.Implements[Reverser]
}

func (r *reverser) Reverse(_ context.Context, s string) (string, error) {
    runes := []rune(s)
    n := len(runes)
    for i := 0; i < n/2; i++ {
        runes[i], runes[n-i-1] = runes[n-i-1], runes[i]
    }
    return string(runes), nil
}
The Reverser component is represented by a Reverser interface with,
unsurprisingly, a Reverse method that reverses strings. The reverser struct
is our implementation of the Reverser component (as indicated by the
weaver.Implements[Reverser] field it contains).
Next, edit the app component in main.go to use the Reverser component:
package main

import (
    "context"
    "fmt"
    "log"

    "github.com/ServiceWeaver/weaver"
)

func main() {
    if err := weaver.Run(context.Background(), serve); err != nil {
        log.Fatal(err)
    }
}

type app struct{
    weaver.Implements[weaver.Main]
    reverser weaver.Ref[Reverser]
}

func serve(ctx context.Context, app *app) error {
    // Call the Reverse method.
    var r Reverser = app.reverser.Get()
    reversed, err := r.Reverse(ctx, "!dlroW ,olleH")
    if err != nil {
        return err
    }
    fmt.Println(reversed)
    return nil
}
The app struct has a new field of type weaver.Ref[Reverser] that provides
access to the Reverser component.
In general, if component X uses component Y, the implementation struct for X
should contain a field of type weaver.Ref[Y]. When an X component instance is
created, Service Weaver will automatically create the Y component as well and
will fill the weaver.Ref[Y] field with a handle to the Y component. The
implementation of X can call Get() on the weaver.Ref[Y] field to get the Y
component, as demonstrated by the following lines in the preceding examples:
    var r Reverser = app.reverser.Get()
    reversed, err := r.Reverse(ctx, "!dlroW ,olleH")
Service Weaver is designed for writing serving systems. In this section, we'll
augment our app to serve HTTP traffic using a network listener. Rewrite
main.go with the following contents:
package main

import (
    "context"
    "fmt"
    "log"
    "net/http"

    "github.com/ServiceWeaver/weaver"
)

func main() {
    if err := weaver.Run(context.Background(), serve); err != nil {
        log.Fatal(err)
    }
}

type app struct {
    weaver.Implements[weaver.Main]
    reverser weaver.Ref[Reverser]
    hello    weaver.Listener
}

func serve(ctx context.Context, app *app) error {
    // The hello listener will listen on a random port chosen by the operating
    // system. This behavior can be changed in the config file.
    fmt.Printf("hello listener available on %v\n", app.hello)

    // Serve the /hello endpoint.
    http.HandleFunc("/hello", func(w http.ResponseWriter, r *http.Request) {
        name := r.URL.Query().Get("name")
        if name == "" {
            name = "World"
        }
        reversed, err := app.reverser.Get().Reverse(ctx, name)
        if err != nil {
            http.Error(w, err.Error(), http.StatusInternalServerError)
            return
        }
        fmt.Fprintf(w, "Hello, %s!\n", reversed)
    })
    return http.Serve(app.hello, nil)
}
Here's an explanation of the code:
hello field in the app struct declares a network listener, similar to
net.Listen.http.HandleFunc(...) registers an HTTP handler for the /hello?name=<name>
endpoint that returns a reversed greeting by calling the Reverser.Reverse
method.http.Serve(lis, nil) runs the HTTP server on the provided listener.By default, all application listeners listen on a random port chosen by the
operating system. Here, we want to change this default behavior and assign a
fixed local listener port for the hello listener. To do so, create a
TOML config file named weaver.toml with
the following contents:
[single]
listeners.hello = {address = "localhost:12345"}
Note that the name of the listener, hello in this case, is derived from the
field name. You can override this behavior and specify a specific listener name
using a "weaver" field tag like this:
type app struct {
    weaver.Implements[weaver.Main]
    reverser weaver.Ref[Reverser]
    hello    weaver.Listener `weaver:"my_custom_listener_name"`
}
Listener names must be valid Go identifiers. For example, the
names "foo", "bar42", and "_moo" are legal, while "", "foo bar", and
"foo-bar" are illegal.
Run weaver generate, then go mod tidy, and then
SERVICEWEAVER_CONFIG=weaver.toml go run ..
The program should print out the name of the application and a unique
deployment id. It should then block serving HTTP requests on localhost:12345.
$ weaver generate
$ go mod tidy
$ go run .
╭───────────────────────────────────────────────────╮
│ app        : hello                                │
│ deployment : 5c9753e4-c476-4f93-97a0-0ea599184178 │
╰───────────────────────────────────────────────────╯
hello listener available on 127.0.0.1:12345
...
In a separate terminal, curl the server to receive a reversed greeting:
$ curl "localhost:12345/hello?name=Weaver"
Hello, revaeW!
Run weaver single status to view the status of the Service Weaver application.
The status shows every deployment, component, and listener.
$ weaver single status
╭────────────────────────────────────────────────────╮
│ DEPLOYMENTS                                        │
├───────┬──────────────────────────────────────┬─────┤
│ APP   │ DEPLOYMENT                           │ AGE │
├───────┼──────────────────────────────────────┼─────┤
│ hello │ 5c9753e4-c476-4f93-97a0-0ea599184178 │ 1s  │
╰───────┴──────────────────────────────────────┴─────╯
╭────────────────────────────────────────────────────╮
│ COMPONENTS                                         │
├───────┬────────────┬────────────────┬──────────────┤
│ APP   │ DEPLOYMENT │ COMPONENT      │ REPLICA PIDS │
├───────┼────────────┼────────────────┼──────────────┤
│ hello │ 5c9753e4   │ main           │ 691625       │
│ hello │ 5c9753e4   │ hello.Reverser │ 691625       │
╰───────┴────────────┴────────────────┴──────────────╯
╭─────────────────────────────────────────────────╮
│ LISTENERS                                       │
├───────┬────────────┬──────────┬─────────────────┤
│ APP   │ DEPLOYMENT │ LISTENER │ ADDRESS         │
├───────┼────────────┼──────────┼─────────────────┤
│ hello │ 5c9753e4   │ hello    │ 127.0.0.1:12345 │
╰───────┴────────────┴──────────┴─────────────────╯
You can also run weaver single dashboard to open a dashboard in a web browser.
We've seen how to run a Service Weaver application in a single process with go run. Now, we'll run our application in multiple processes, with method calls
between components executed as RPCs. First, create a TOML
config file named weaver.toml with the following contents:
[serviceweaver]
binary = "./hello"

[multi]
listeners.hello = {address = "localhost:12345"}
This config file specifies the binary of the Service Weaver application, as
well as a fixed address for the hello listener. Next, build and run the app
using weaver multi deploy:
$ go build                        # build the ./hello binary
$ weaver multi deploy weaver.toml # deploy the application
╭───────────────────────────────────────────────────╮
│ app        : hello                                │
│ deployment : 6b285407-423a-46cc-9a18-727b5891fc57 │
╰───────────────────────────────────────────────────╯
S1205 10:21:15.450917 stdout  26b601c4] hello listener available on 127.0.0.1:12345
S1205 10:21:15.454387 stdout  88639bf8] hello listener available on 127.0.0.1:12345
Note: weaver multi replicates every component twice, which is why you see
two log entries. We elaborate on replication more in the
Components section later.
In a separate terminal, curl the server:
$ curl "localhost:12345/hello?name=Weaver"
Hello, revaeW!
When the main component receives your /hello HTTP request, it calls the
reverser.Reverse method. This method call is executed as an RPC to the
Reverser component running in a different process. Remember earlier when we
ran weaver generate, the Service Weaver code generator? One thing that weaver generate does is generate RPC clients and servers for every component to make
this communication possible.
Run weaver multi status to view the status of the Service Weaver application.
Note that the main and Reverser components are replicated twice, and every
replica is run in its own OS process.
$ weaver multi status
╭────────────────────────────────────────────────────╮
│ DEPLOYMENTS                                        │
├───────┬──────────────────────────────────────┬─────┤
│ APP   │ DEPLOYMENT                           │ AGE │
├───────┼──────────────────────────────────────┼─────┤
│ hello │ 6b285407-423a-46cc-9a18-727b5891fc57 │ 3s  │
╰───────┴──────────────────────────────────────┴─────╯
╭──────────────────────────────────────────────────────╮
│ COMPONENTS                                           │
├───────┬────────────┬────────────────┬────────────────┤
│ APP   │ DEPLOYMENT │ COMPONENT      │ REPLICA PIDS   │
├───────┼────────────┼────────────────┼────────────────┤
│ hello │ 6b285407   │ main           │ 695110, 695115 │
│ hello │ 6b285407   │ hello.Reverser │ 695136, 695137 │
╰───────┴────────────┴────────────────┴────────────────╯
╭─────────────────────────────────────────────────╮
│ LISTENERS                                       │
├───────┬────────────┬──────────┬─────────────────┤
│ APP   │ DEPLOYMENT │ LISTENER │ ADDRESS         │
├───────┼────────────┼──────────┼─────────────────┤
│ hello │ 6b285407   │ hello    │ 127.0.0.1:12345 │
╰───────┴────────────┴──────────┴─────────────────╯
You can also run weaver multi dashboard to open a dashboard in a web browser.
The ability to run Service Weaver applications locally—either in a single
process with go run or across multiple processes with weaver multi deploy—makes it easy to quickly develop, debug, and test your
applications. When your application is ready for production, however, you'll
often want to deploy it to the cloud. Service Weaver makes this easy too.
For example, we can deploy our "Hello, World" application to Google Kubernetes Engine, Google Cloud's hosted Kubernetes offering, as easily as running a single command (see the GKE section for details):
$ weaver gke deploy weaver.toml
When you run this command, Service Weaver will
Service Weaver also integrates your application with existing cloud tooling. Logs are uploaded to Google Cloud Logging, metrics are uploaded to Google Cloud Monitoring, traces are uploaded to Google Cloud Tracing, etc.
Check out the Service Weaver codelab hosted on GitHub. The codelab includes a set of exercises (with solutions) that walk you through the implementation of an emoji search engine application backed by ChatGPT. The Step by Step Tutorial section walked you through the fundamentals of Service Weaver, and the codelab puts these fundamentals to practice, giving you hands-on experience writing fully fledged Service Weaver applications.
Components are Service Weaver's core abstraction. A component is a
long-lived, possibly replicated entity that exposes a set of methods.
Concretely, a component is represented as a Go interface and corresponding
implementation of that interface. Consider the following Adder component for
example:
type Adder interface {
    Add(context.Context, int, int) (int, error)
}

type adder struct {
    weaver.Implements[Adder]
}

func (*adder) Add(_ context.Context, x, y int) (int, error) {
    return x + y, nil
}
Adder defines the component's interface, and adder defines the component's
implementation. The two are linked with the embedded weaver.Implements[Adder]
field. You can call weaver.Ref[Adder].Get() to get a client to the Adder
component. The returned client implements the component's interface, so you can
invoke the component's methods as you would any regular Go method. When you
invoke a component's method, the method call is performed by one of the possibly
many component replicas.
Components are generally long-lived, but the Service Weaver runtime may scale up or scale down the number of replicas of a component over time based on load. Similarly, component replicas may fail and get restarted. Service Weaver may also move component replicas around, co-locating two chatty components in the same OS process, for example, so that communication between the components is done locally rather than over the network.
When invoking a component's method, be prepared that it may be executed via a remote procedure call. As a result, your call may fail with a network error instead of an application error. If you don't want to deal with network errors, you can explicitly place the two components in the same colocation group, ensuring that they always run in the same OS process.
Every method in a component interface must receive a context.Context as its
first argument and return an error as its final result. All other arguments
must be serializable. These are all valid component
methods:
a(context.Context) error
b(context.Context, int) error
c(context.Context) (int, error)
d(context.Context, int) (int, error)
These are all invalid component methods:
a() error                          // no context.Context argument
b(context.Context)                 // no error result
c(int, context.Context) error      // first argument isn't context.Context
d(context.Context) (error, int)    // final result isn't error
e(context.Context, chan int) error // chan int isn't serializable
A component implementation must be a struct that looks like:
type foo struct{
    weaver.Implements[Foo]
    // ...
}
weaver.Implements[T] field where T is the component
interface it implements.If a component implementation implements an Init(context.Context) error
method, it will be called when an instance of the component is created.
func (f *foo) Init(context.Context) error {
    // ...
}
If a component implementation implements an Shutdown(context.Context) error
method, it will be called when an instance of the component is destroyed.
func (f *foo) Shutdown(context.Context) error {
    // ...
}
Note: There is no guarantee that the Shutdown method will always
be called. Shutdown is called iff your application receives a
SIGINT or a SIGTERM signal. However, if the machine where your application runs
crashes unexpectedly or becomes unresponsive, the Shutdown method is never called.
When implementing a component, there are a few semantic details to keep in mind:
Take the following Cache component for example, which maintains an in-memory
key-value cache.
type Cache interface {
    Put(ctx context.Context, key, value string) error
    Get(ctx context.Context, key string) (string, error)
}

type cache struct {
    mu sync.Mutex
    data map[string]string
}

func (c *Cache) Put(_ context.Context, key, value string) error {
    c.mu.Lock()
    defer c.mu.Unlock()
    c.data[key] = value
    return nil
}

func (c *Cache) Get(_ context.Context, key string) (string, error) {
    c.mu.Lock()
    defer c.mu.Unlock()
    return c.data[key], nil
}
Noting the points above:
Cache's state is not persisted, so if a Cache replica fails, its data
is lost. Any state that needs to be persisted should be persisted
explicitly.Cache's methods may be invoked concurrently, so it's essential that we
guard access to data with the mutex mu.Cache component, so it is not
guaranteed that one client's Get will be routed to the same replica as
another client's Put. For this example, this means that the Cache has
weak consistency.If a remote method call fails to execute properly—because of a machine
crash or a network partition, for example—it returns an error with an
embedded weaver.RemoteCallError. Here's an illustrative example:
// Call the cache.Get method.
value, err := cache.Get(ctx, "key")
if errors.Is(err, weaver.RemoteCallError) {
    // cache.Get did not execute properly.
} else if err != nil {
    // cache.Get executed properly, but returned an error.
} else {
    // cache.Get executed properly and did not return an error.
}
Note that if a method call returns an error with an embedded
weaver.RemoteCallError, it does not mean that the method never executed. The
method may have executed partially, or fully, or multiple times due to automatic
retries.
On network errors, a component method call may be retried automatically by Service Weaver. This may cause a single method call to turn into multiple executions of that method. In practice, many methods (e.g., read-only or idempotent methods) work correctly even when executed more than once per call, and this automatic retrying can help make the application more robust in the presence of failures.
However some methods should not be retried automatically. E.g., if our cache was extended with a method that appends a string to a cached value, automatic retrying could cause multiple copies of the argument to be appended to the cached value. Such methods can be specially marked to prevent automatic retries.
type Cache interface{
    ...
    Append(context.Context, key, val string) error
}

// Do not retry Cache.Append.
var _ weaver.NotRetriable = Cache.Append
A component implementation may wish to use one or more network listeners, e.g.,
to serve HTTP network traffic. To do so, named weaver.Listener fields must
be added to the implementation struct. For example, the following component
implementation creates two network listeners:
type impl struct{
    weaver.Implements[MyComponent]
    foo weaver.Listener
    Bar weaver.Listener
}
With Service Weaver, listeners are named. By default, listeners are named
after their corresponding struct fields (e.g., "foo" and "bar" in the
above example). Alternatively, a special weaver:"name" struct tag
can be added to the struct field to specify the listener name explicitly:
type impl struct{
    weaver.Implements[MyComponent]
    foo weaver.Listener
    lis weaver.Listener `weaver:"bar"`
}
Listener names must be unique inside a given application binary, regardless of
which components they are specified in. For example, it is illegal to declare a
Listener field "foo" in two different component implementations structs,
unless one is renamed using the weaver:"name" struct tag.
By default, all application listeners will listen on a random port chosen
by the operating system. This behavior, as well as other customization options,
can be modified in the respective deployers' configuration file. For example,
the following config file will assign addresses "localhost:12345" and
"localhost:12346" to "foo" and "bar", respectively, when the application
is deployed using the multiprocess deployer.
[multi]
listeners.foo = {address = "localhost:12345"}
listeners.bar = {address = "localhost:12346"}
Service Weaver uses config files, written in TOML, to configure how applications are run. A minimal config file, for example, simply lists the application binary:
[serviceweaver]
binary = "./hello"
A config file may additionally contain deployer-specific configuration sections,
which allow you to configure the execution when a given deployer is used.
For example, the following multiprocess config will enable encrypted secure
communication via mTLS between components when the application is deployed using the
multiprocess deployer:
[multi]
mtls = true
A config file may also contain component-specific configuration
sections, which allow you to configure the components in your application. For
example, consider the following Greeter component.
type Greeter interface {
    Greet(context.Context, string) (string, error)
}

type greeter struct {
    weaver.Implements[Greeter]
}

func (g *greeter) Greet(_ context.Context, name string) (string, error) {
    return fmt.Sprintf("Hello, %s!", name), nil
}
Rather than hard-coding the greeting "Hello", we can provide a greeting in a
config file. First, we define a options struct.
type greeterOptions struct {
    Greeting string
}
Next, we associate the options struct with the greeter implementation by
embedding the weaver.WithConfig[T] struct.
type greeter struct {
    weaver.Implements[Greeter]
    weaver.WithConfig[greeterOptions]
}
Now, we can add a Greeter section to the config file. The section is keyed by
the full path-prefixed name of the component.
["example.com/mypkg/Greeter"]
Greeting = "Bonjour"
When the Greeter component is created, Service Weaver will automatically parse
the Greeter section of the config file into a greeterOptions struct. You can
access the populated struct via the Config method of the embedded WithConfig
struct. For example:
func (g *greeter) Greet(_ context.Context, name string) (string, error) {
    greeting := g.Config().Greeting
    if greeting == "" {
        greeting = "Hello"
    }
    return fmt.Sprintf("%s, %s!", greeting, name), nil
}
You can use toml struct tags to specify the name that should be used for a
field in a config file. For example, we can change the greeterOptions struct
to the following.
type greeterOptions struct {
    Greeting string `toml:"my_custom_name"`
}
And change the config file accordingly:
["example.com/mypkg/Greeter"]
my_custom_name = "Bonjour"
If you run an application directly (i.e. using go run), you can pass the
config file using the SERVICEWEAVER_CONFIG environment variable:
$ SERVICEWEAVER_CONFIG=weaver.toml go run .
Or, use weaver single deploy:
$ weaver single deploy weaver.toml
You can propagate metadata information from a component method caller to the callee. The metadata is propagated to the callee even if the caller and the callee are not colocated in the same process.
The metadata is a map from string to string, stored in context.Context. You can
add the map to a context by calling NewContext and retrieve it by calling
FromContext:
...
// Attach metadata with key "save_operation" and value "true" to the context.
// Call the Add method on the adder component.
ctx := context.Background()
ctx = metadata.NewContext(ctx, map[string]string{"save_operation": "true"})
adder.Add(ctx, 1, 2)
...
// Retrieve the metadata from the context
func (*adder) Add(ctx context.Context, x, y int) (int, error) {
    meta, ok := metadata.FromContext(ctx)
    if ok {
        save := meta["save_operation"]
        ...
    }
    ...
}
Service Weaver provides a logging API, weaver.Logger. By using Service
Weaver's logging API, you can cat, tail, search, and filter logs from every one
of your Service Weaver applications (past or present). Service Weaver also
integrates the logs into the environment where your application is deployed. If
you deploy a Service Weaver application to Google Cloud, for example,
logs are automatically exported to Google Cloud Logging.
Use the Logger method of a component implementation to get a logger scoped to
the component. For example:
type Adder interface {
    Add(context.Context, int, int) (int, error)
}

type adder struct {
    weaver.Implements[Adder]
}

func (a *adder) Add(ctx context.Context, x, y int) (int, error) {
    // adder embeds weaver.Implements[Adder] which provides the Logger method.
    logger := a.Logger(ctx)
    logger.Debug("A debug log.")
    logger.Info("An info log.")
    logger.Error("An error log.", fmt.Errorf("an error"))
    return x + y, nil
}
Logs look like this:
D1103 08:55:15.650138 main.Adder 73ddcd04 adder.go:12 │ A debug log.
I1103 08:55:15.650149 main.Adder 73ddcd04 adder.go:13 │ An info log.
E1103 08:55:15.650158 main.Adder 73ddcd04 adder.go:14 │ An error log. err="an error"
The first character of a log line indicates whether the log is a [D]ebug,
[I]nfo, or [E]rror log entry. Then comes the date in MMDD format, followed by
the time. Then comes the component name followed by a logical node id. If two
components are co-located in the same OS process, they are given the same node
id. Then comes the file and line where the log was produced, followed finally by
the contents of the log.
Service Weaver also allows you to attach key-value attributes to log entries. These attributes can be useful when searching and filtering logs.
logger.Info("A log with attributes.", "foo", "bar") // adds foo="bar"
If you find yourself adding the same set of key-value attributes repeatedly, you can pre-create a logger that will add those attributes to all log entries:
fooLogger = logger.With("foo", "bar")
fooLogger.Info("A log with attributes.")  // adds foo="bar"
Note: You can also add normal print statements to your code. These prints
will be captured and logged by Service Weaver, but they won't be associated with
a particular component, they won't have file:line information, and they won't
have any attributes, so we recommend you use a weaver.Logger whenever
possible.
S1027 14:40:55.210541 stdout d772dcad] This was printed by fmt.Println
Refer to the deployer-specific documentation to learn how to search and filter logs for single process, multiprocess, and GKE deployments.
Service Weaver provides an API for metrics; specifically counters, gauges, and histograms.
Service Weaver integrates these metrics into the environment where your application is deployed. If you deploy a Service Weaver application to Google Cloud, for example, metrics are automatically exported to the Google Cloud Metrics Explorer where they can be queried, aggregated, and graphed.
Here's an example of how to add metrics to a simple Adder component.
var (
    addCount = metrics.NewCounter(
        "add_count",
        "The number of times Adder.Add has been called",
    )
    addConcurrent = metrics.NewGauge(
        "add_concurrent",
        "The number of concurrent Adder.Add calls",
    )
    addSum = metrics.NewHistogram(
        "add_sum",
        "The sums returned by Adder.Add",
        []float64{1, 10, 100, 1000, 10000},
    )
)

type Adder interface {
    Add(context.Context, int, int) (int, error)
}

type adder struct {
    weaver.Implements[Adder]
}

func (*adder) Add(_ context.Context, x, y int) (int, error) {
    addCount.Add(1.0)
    addConcurrent.Add(1.0)
    defer addConcurrent.Sub(1.0)
    addSum.Put(float64(x + y))
    return x + y, nil
}
Refer to the deployer-specific documentation to learn how to view metrics for single process, multiprocess, and GKE deployments.
Metrics can also have a set of key-value labels. Service Weaver represents
labels using structs. Here's an example of how to declare and use a labeled
counter to count the parity of the argument to a Halve method.
type halveLabels struct {
    Parity string // "odd" or "even"
}

var (
    halveCounts = metrics.NewCounterMap[halveLabels](
        "halve_count",
        "The number of values that have been halved",
    )
    oddCount = halveCounts.Get(halveLabels{"odd"})
    evenCount = halveCounts.Get(halveLabels{"even"})
)

type Halver interface {
    Halve(context.Context, int) (int, error)
}

type halver struct {
    weaver.Implements[Halver]
}

func (halver) Halve(_ context.Context, val int) (int, error) {
    if val % 2 == 0 {
        evenCount.Add(1)
    } else {
        oddCount.Add(1)
    }
    return val / 2, nil
}
To adhere to popular metric naming conventions, Service
Weaver lowercases the first letter of every label by default. The Parity field
for example is exported as parity. You can override this behavior and provide
a custom label name using a weaver annotation.
type labels struct {
    Foo string                           // exported as "foo"
    Bar string `weaver:"my_custom_name"` // exported as "my_custom_name"
}
Service Weaver automatically creates and maintains the following set of metrics, which measure the count, latency, and chattiness of every component method invocation. Every metric is labeled by the calling component as well as the invoked component and method, and whether or not the call was local or remote.
serviceweaver_method_count: Count of Service Weaver component
method invocations.serviceweaver_method_error_count: Count of Service Weaver component
method invocations that result in an error.serviceweaver_method_latency_micros: Duration, in microseconds, of
Service Weaver component method execution.serviceweaver_method_bytes_request: Number of bytes in Service
Weaver remote component method requests.serviceweaver_method_bytes_reply: Number of bytes in Service Weaver
remote component method replies.Service Weaver declares the following set of HTTP related metrics.
serviceweaver_http_request_count: Count of HTTP requests.serviceweaver_http_error_count: Count of HTTP requests resulting in a 4XX or 5XX
response. This metric is also labeled with the returned status code.serviceweaver_http_request_latency_micros: Duration, in microseconds, of HTTP
request execution.serviceweaver_http_request_bytes_received: Estimated number of bytes received by
an HTTP handler.serviceweaver_http_request_bytes_returned: Estimated number of bytes returned by
an HTTP handler.If you pass an http.Handler to the
weaver.InstrumentHandler function, it will return a new http.Handler that
updates these metrics automatically, labeled with the provided label. For
example:
// Metrics are recorded for fooHandler with label "foo".
var mux http.ServeMux
var fooHandler http.Handler = ...
mux.Handle("/foo", weaver.InstrumentHandler("foo", fooHandler))
Service Weaver relies on OpenTelemetry to trace your application. Service Weaver exports these traces into the environment where your application is deployed. If you deploy a Service Weaver application to Google Cloud, for example, traces are automatically exported to Google Cloud Trace.
If you pass an http.Handler to the
weaver.InstrumentHandler function, it will return a new http.Handler that
traces an HTTP request every second.
// Tracing is enabled for one request every second.
var mux http.ServeMux
var fooHandler http.Handler = ...
mux.Handle("/foo", weaver.InstrumentHandler("foo", fooHandler))
Alternatively, you can enable tracing manually using the OpenTelemetry libraries:
import (
    "context"
    "fmt"
    "log"
    "net/http"

    "go.opentelemetry.io/contrib/instrumentation/net/http/otelhttp"
    "github.com/ServiceWeaver/weaver"
)

func main() {
    if err := weaver.Run(context.Background(), serve); err != nil {
        log.Fatal(err)
    }
}

type app struct {
    weaver.Implements[weaver.Main]
    lis weaver.Listener
}

func serve(ctx context.Context, app *app) error {
    fmt.Printf("hello listener available on %v\n", app.lis)

    // Serve the /hello endpoint.
    http.HandleFunc("/hello", func(w http.ResponseWriter, r *http.Request) {
        fmt.Fprintf(w, "Hello, %s!\n", r.URL.Query().Get("name"))
    })

    // Create an otel handler to manually enable tracing.
    otelHandler := otelhttp.NewHandler(http.DefaultServeMux, "http")
    return http.Serve(lis, otelHandler)
}
Regardless of whether you use weaver.InstrumentHandler or you manually enable
tracing, once tracing is enabled for a given HTTP request, that request
and the resulting component method calls will be automatically traced. Service
Weaver will collect and export the traces for you. Refer to the
deployer-specific documentation for single process,
multiprocess, and GKE to learn about
deployer-specific exporters.
The steps above are all you need to get started with tracing. If you want to add
more application-specific details to your traces, you can add attributes,
events, and errors using the context passed to registered HTTP handlers and
component methods. For example, in our hello example, you can add an event as
follows:
http.HandleFunc("/hello", func(w http.ResponseWriter, r *http.Request) {
    fmt.Fprintf(w, "Hello, %s!\n", r.URL.Query().Get("name"))
    trace.SpanFromContext(r.Context()).AddEvent("writing response",
        trace.WithAttributes(
            label.String("content", "hello "),
            label.String("answer", r.URL.Query().Get("name")),
        ))
})
Refer to OpenTelemetry Go: All you need to know to learn more about how to add more application-specific details to your traces.
Service Weaver allows you to profile an entire Service Weaver application, even one that is deployed in multiple processes across multiple machines. Service Weaver profiles every individual binary and aggregates them into a single profile that captures the performance of the application as a whole. Refer to the deployer-specific documentation for details on how to collect profiles for single process, multiprocess, and GKE deployments.
By default, when a client invokes a remote component's method, this method call
will be performed by one of possibly many component replicas, selected
arbitrarily. It is sometimes beneficial for method invocations to be routed to
a particular replica based on the arguments provided to the method. For
example, consider a Cache component that maintains an in-memory cache in front
of an underlying disk-backed key-value store:
type Cache interface {
    Get(ctx context.Context, key string) (string, error)
    Put(ctx context.Context, key, value string) error
}

type cache struct {
    weaver.Implements[Cache]
    // ...
}
To increase the cache hit ratio, we may want to route every request for a given key to the same replica. Service Weaver supports this affinity based routing by allowing the application to specify a router type associated with the component implementation. For example:
type cacheRouter struct{}
func (cacheRouter) Get(_ context.Context, key string) string { return key }
func (cacheRouter) Put(_ context.Context, key, value string) string { return key }
For every component method that needs to be routed (e.g., Get and Put), the
router type should implement an equivalent method (i.e., same name and
argument types) whose return type is the routing key. When a component's routed
method is invoked, its corresponding router method is invoked to produce a
routing key. Method invocations that produce the same key are routed to the same
replica.
A routing key can be
int, int32), float (i.e. float32, float64), or
string; orweaver.AutoMarshal, and all remaining
fields must be either integers, floats, or strings. (e.g.
struct{weaver.AutoMarshal; x int; y string}, struct{x int; y string}, etc )Every router method must return the same routing key type. The following, for example, is invalid:
// ERROR: Get returns a string, but Put returns an int.
func (cacheRouter) Get(_ context.Context, key string) string { return key }
func (cacheRouter) Put(_ context.Context, key, value string) int { return 42 }
To associate a router with its component, embed a weaver.WithRouter[T] field in
the component implementation where T is the type of the router.
type cache struct {
    weaver.Implements[Cache]
    weaver.WithRouter[cacheRouter]
    // ...
}
NOTE: Routing is done on a best-effort basis. Service Weaver will try to route method invocations with the same key to the same replica, but this is not guaranteed. As a corollary, you should never depend on routing for correctness. Only use routing to increase performance in the common case.
Also note that if a component invokes a method on a co-located component, the method call will always be executed by the co-located component and won't be routed.
We expect most Service Weaver applications to persist their data in some way. For example, an e-commerce application may store its products catalog and user information in a database and access them while serving user requests.
By default, Service Weaver leaves the storage and retrieval of application data up to the developer. If you're using a database, for example, you have to create the database, pre-populate it with data, and write the code to access the database from your Service Weaver application.
Below is an example of how database information can be passed to a simple
Adder component using a config file. First, the config
file:
["example.com/mypkg/Adder"]
Driver = "mysql"
Source = "root:@tcp(localhost:3306)/"
And the application that uses it:
type Adder interface {
    Add(context.Context, int, int) (int, error)
}

type adder struct {
    weaver.Implements[Adder]
    weaver.WithConfig[config]

    db *sql.DB
}

type config struct {
    Driver string // Name of the DB driver.
    Source string // DB data source.
}

func (a *adder) Init(_ context.Context) error {
    db, err := sql.Open(a.Config().Driver, a.Config().Source)
    a.db = db
    return err
}

func (a *Adder) Add(ctx context.Context, x, y int) (int, error) {
    // Check in the database first.
    var sum int
    const q = "SELECT sum FROM table WHERE x=? AND y=?;"
    if err := a.db.QueryRowContext(ctx, q, x, y).Scan(&sum); err == nil {
        return sum, nil
    }

    // Make a best-effort attempt to store in the database.
    q = "INSERT INTO table(x, y, sum) VALUES (?, ?, ?);"
    a.db.ExecContext(ctx, q, x, y, x + y)
    return x + y, nil
}
A similar process can be followed to pass database information using Go flags or environment variables.
Service Weaver includes a weavertest package that you can use to test your
Service Weaver applications. The package provides a Runner type with Test
and Bench methods. Tests use Runner.Test instead of weaver.Run. To test an
Adder component with an Add method, for example, create an adder_test.go
file with the following contents.
package main

import (
    "context"
    "testing"

    "github.com/ServiceWeaver/weaver"
    "github.com/ServiceWeaver/weaver/weavertest"
)

func TestAdd(t *testing.T) {
     runner := weavertest.Local  // A runner that runs components in a single process
     runner.Test(t, func(t *testing.T, adder Adder) {
         ctx := context.Background()
         got, err := adder.Add(ctx, 1, 2)
         if err != nil {
             t.Fatal(err)
         }
         if want := 3; got != want {
             t.Fatalf("got %q, want %q", got, want)
         }
     })
}
Run go test to run the test. runner.Test will create a sub-test and within
it will create an Adder component and pass it to the supplied function. If you
want to test the implementation of a component, rather than its interface,
specify a pointer to the implementing struct as an argument. For example, if the
adderImpl struct implemented the Adder interface, we could write the following:
runner.Test(t, func(t *testing.T, adder *adderImpl) {
    // Test adder...
})
Tests that want to exercise multiple components can pass a function with a separate argument per component. Each of those components will be created and passed to the function. Each argument can be a component interface or a pointer to a component implementation.
func TestArithmetic(t *testing.T) {
    weavertest.Local.Test(t, func(t *testing.T, adder *adderImpl, multiplier Multiplier) {
        // ...
    })
}
weavertest provides a set of builtin Runners that differ in how they partition
components across processes and how the components communicate with each other:
go run a Service Weaver application.weaver multi deploy.Tests run using weavertest.Local are easier to debug and troubleshoot, but do
not test distributed execution. You should test with different runners to get
the best of both worlds (each Runner.Test call will create a new sub-test):
func TestAdd(t *testing.T) {
    for _, runner := range weavertest.AllRunners() {
        runner.Test(t, func(t *testing.T, adder Adder) {
            // ...
        })
    }
}
You can replace a component implementation with a fake implementation in a test
using weavertest.Fake. Here's an example where we replace
the real implementation of a Clock component with a fake implementation that
always returns a fixed time.
// fakeClock is a fake implementation of the Clock component.
type fakeClock struct {
    now int64
}

// Now implements the Clock component interface. It returns the current time, in
// microseconds, since the unix epoch.
func (f *fakeClock) Now(context.Context) (int64, error) {
    return f.now, nil
}

func TestClock(t *testing.T) {
    for _, runner := range weavertest.AllRunners() {
        // Register a fake Clock implementation with the runner.
        fake := &fakeClock{100}
        runner.Fakes = append(runner.Fakes, weavertest.Fake[Clock](fake))

        // When a fake is registered for a component, all instances of that
        // component dispatch to the fake.
        runner.Test(t, func(t *testing.T, clock Clock) {
            now, err := clock.UnixMicro(context.Background())
            if err != nil {
                t.Fatal(err)
            }
            if now != 100 {
                t.Fatalf("bad time: got %d, want %d", now, 100)
            }

            fake.now = 200
            now, err = clock.UnixMicro(context.Background())
            if err != nil {
                t.Fatal(err)
            }
            if now != 200 {
                t.Fatalf("bad time: got %d, want %d", now, 200)
            }
        })
    }
}
You can also provide the contents of a config file to a runner
by setting the Runner.Config field:
func TestArithmetic(t *testing.T) {
    runner := weavertest.Local()
    runner.Name = "Custom"
    runner.Config = `[serviceweaver] ...`
    runner.Test(t, func(t *testing.T, adder Adder, multiplier Multiplier) {
        // ...
    })
}
Serving systems evolve over time. Whether you're fixing bugs or adding new features, it is inevitable that you will have to roll out a new version of your system to replace the currently running version. To maintain the availability of their systems, people typically perform rolling updates, where the nodes in a deployment are updated from the old version to the new version one by one.
During a rolling update, nodes running the old version of the code will have to communicate with other nodes running the new version of the code. Ensuring that a system is correct despite the possibility of these cross-version interactions is very challenging. In Understanding and Detecting Software Upgrade Failures in Distributed Systems, Zhang et al. perform a case study of 123 failed updates in 8 widely used systems. They found that the majority of failures were caused by the interactions between multiple versions of a system:
About two thirds of update failures are caused by interaction between two software versions that hold incompatible data syntax or semantics assumption.
Service Weaver takes a different approach to rollouts and sidesteps these complex cross-version interactions. Service Weaver ensures that client requests are executed entirely within a single version of a system. A component in one version will never communicate with a component in a different version. This eliminates the leading cause of update failures, allowing you to roll out new versions of your Service Weaver application safely and with less headache.
Avoiding cross-version communication is trivial for applications deployed using
go run or weaver multi deploy because
every deployment runs independently from one another. Refer to the
GKE Deployments and
GKE Versioning sections to learn how Service Weaver uses a combination
of blue/green deployments and autoscaling to slowly shift traffic
from an old version of a Service Weaver application running on GKE to a new version,
avoiding cross-version communication in a resource-efficient manner.
The simplest and easiest way to deploy a Service Weaver application is to run it
directly via go run. When you go run a Service Weaver application, every
component is co-located in a single process, and method calls between components
are executed as regular Go method calls. Refer to the Step by Step
Tutorial section for a full example.
$ go run .
If you run an application using go run, you can provide a config file using
the SERVICEWEAVER_CONFIG environment variable:
$ SERVICEWEAVER_CONFIG=weaver.toml go run .
Or, you can use the weaver single deploy command. weaver single deploy is
practically identical to go run ., but it makes it easier to provide a config
file.
$ weaver single deploy weaver.toml
You can run weaver single status to view the status of all active Service
Weaver applications deployed using go run.
$ weaver single status
╭────────────────────────────────────────────────────╮
│ DEPLOYMENTS                                        │
├───────┬──────────────────────────────────────┬─────┤
│ APP   │ DEPLOYMENT                           │ AGE │
├───────┼──────────────────────────────────────┼─────┤
│ hello │ a4bba25b-6312-4af1-beec-447c33b8e805 │ 26s │
│ hello │ a4d4c71b-a99f-4ade-9586-640bd289158f │ 19s │
│ hello │ bc663a25-c70e-440d-b022-04a83708c616 │ 12s │
╰───────┴──────────────────────────────────────┴─────╯
╭─────────────────────────────────────────────────────╮
│ COMPONENTS                                          │
├───────┬────────────┬─────────────────┬──────────────┤
│ APP   │ DEPLOYMENT │ COMPONENT       │ REPLICA PIDS │
├───────┼────────────┼─────────────────┼──────────────┤
│ hello │ a4bba25b   │ main            │ 123450       │
│ hello │ a4bba25b   │ hello.Reverser  │ 123450       │
│ hello │ a4d4c71b   │ main            │ 903510       │
│ hello │ a4d4c71b   │ hello.Reverser  │ 903510       │
│ hello │ bc663a25   │ main            │ 489102       │
│ hello │ bc663a25   │ hello.Reverser  │ 489102       │
╰───────┴────────────┴─────────────────┴──────────────╯
╭────────────────────────────────────────────╮
│ LISTENERS                                  │
├───────┬────────────┬──────────┬────────────┤
│ APP   │ DEPLOYMENT │ LISTENER │ ADDRESS    │
├───────┼────────────┼──────────┼────────────┤
│ hello │ a4bba25b   │ hello    │ [::]:33541 │
│ hello │ a4d4c71b   │ hello    │ [::]:41619 │
│ hello │ bc663a25   │ hello    │ [::]:33319 │
╰───────┴────────────┴──────────┴────────────╯
You can also run weaver single dashboard to open a dashboard in a web browser.
You can add weaver.Listener fields to the component implementation to trigger
creation of network listeners (see the
Step by Step Tutorial section for context).
type app struct {
    weaver.Implements[weaver.Main]
    hello    weaver.Listener
}
When you deploy an application using go run, the network listeners will be
automatically created by the Service Weaver runtime. Each listener will listen
on a random port chosen by the operating system, unless a concrete address
has been specified in the singleprocess section of the
config file, e.g.:
[single]
listeners.hello = { address = "localhost:12345" }
When you deploy a Service Weaver application with go run, logs are
printed to standard out. These logs are not persisted. You can optionally save
the logs for later analysis using basic shell constructs:
$ go run . | tee mylogs.txt
Run weaver single dashboard to open a dashboard in a web browser. The
dashboard has a page for every Service Weaver application deployed via go run .. Every deployment's page has a link to the deployment's metrics.
The metrics are exported in Prometheus format and looks something
like this:
# Metrics in Prometheus text format [1].
#
# To visualize and query the metrics, make sure Prometheus is installed on
# your local machine and then add the following stanza to your Prometheus yaml
# config file:
#
# scrape_configs:
# - job_name: 'prometheus-serviceweaver-scraper'
#   scrape_interval: 5s
#   metrics_path: /debug/serviceweaver/prometheus
#   static_configs:
#     - targets: ['127.0.0.1:43087']
#
# [1]: https://prometheus.io

# HELP example_count An example counter.
# TYPE example_count counter
example_count{serviceweaver_node="bbc9beb5"} 42
example_count{serviceweaver_node="00555c38"} 9001

# ┌─────────────────────────────────────┐
# │ SERVICEWEAVER AUTOGENERATED METRICS │
# └─────────────────────────────────────┘
# HELP serviceweaver_method_count Count of Service Weaver component method invocations
# TYPE serviceweaver_method_count counter
serviceweaver_method_count{caller="main",component="main.Example",serviceweaver_node="9fa07495",method="Foo"} 0
serviceweaver_method_count{caller="main",component="main.Example",serviceweaver_node="ee76816d",method="Foo"} 1
...
As the header explains, you can visualize and query the metrics by installing
Prometheus and configuring it, using the provided stanza, to periodically scrape
the /debug/serviceweaver/prometheus endpoint of the provided target
(127.0.0.1:43087 in the example above). You can also inspect the metrics
manually. The metrics page shows the latest value of every metric in your
application followed by the metrics that Service Weaver automatically creates
for you.
Use the weaver single profile command to collect a profile of your Service Weaver
application. Invoke the command with the id of your deployment. For example,
imagine you go run your Service Weaver application and it gets a deployment id
28807368-1101-41a3-bdcb-9625e0f02ca0.
$ go run .
╭───────────────────────────────────────────────────╮
│ app        : hello                                │
│ deployment : 28807368-1101-41a3-bdcb-9625e0f02ca0 │
╰───────────────────────────────────────────────────╯
In a separate terminal, you can run the weaver single profile command.
$ weaver single profile 28807368               # Collect a CPU profile.
$ weaver single profile --duration=1m 28807368 # Adjust the duration of the profile.
$ weaver single profile --type=heap 28807368   # Collect a heap profile.
weaver single profile prints out the filename of the collected profile. You can
use the go tool pprof command to visualize and analyze the profile. For
example:
$ profile=$(weaver single profile <deployment>) # Collect the profile.
$ go tool pprof -http=localhost:9000 $profile   # Visualize the profile.
Refer to weaver single profile --help for more details. Refer to go tool pprof --help for more information on how to use pprof to analyze your profiles. Refer
to Profiling Go Programs for a tutorial.
Run weaver single dashboard to open a dashboard in a web browser. The
dashboard has a page for every Service Weaver application deployed via go run .. Every deployment's page has a link to the deployment's traces
accessible via Perfetto. Here's an example of what the tracing page
looks like:
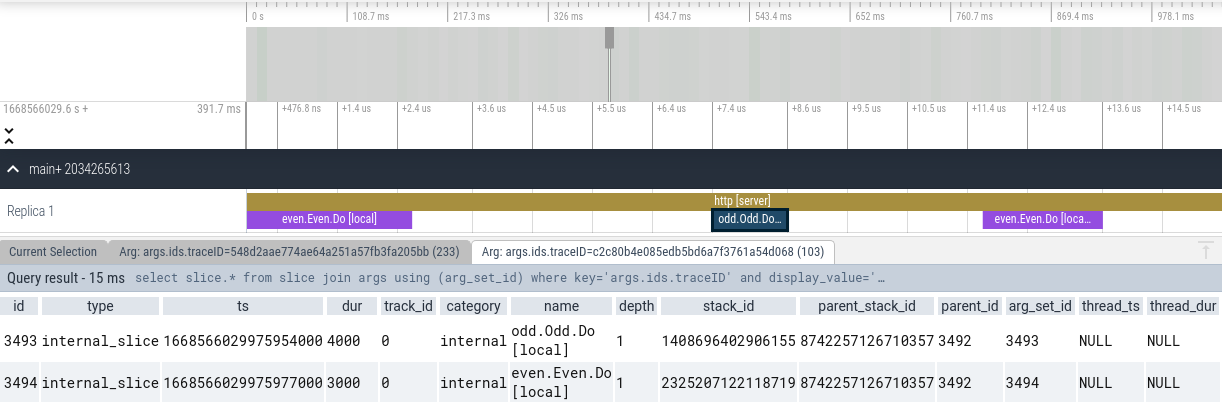
Refer to Perfetto UI Docs to learn more about how to use the tracing UI.
You can use weaver multi to deploy a Service Weaver application across
multiple processes on your local machine, with each component replica running in
a separate OS process. Create a config file, say weaver.toml,
that points to your compiled Service Weaver application.
[serviceweaver]
binary = "./your_compiled_serviceweaver_binary"
Deploy the application using weaver multi deploy:
$ weaver multi deploy weaver.toml
Refer to the Step by Step Tutorial section for a full example.
When weaver multi deploy terminates (e.g., when you press ctrl+c), the
application is destroyed and all processes are terminated.
You can run weaver multi status to view the status of all active Service Weaver
applications deployed using weaver multi.
$ weaver multi status
╭────────────────────────────────────────────────────╮
│ DEPLOYMENTS                                        │
├───────┬──────────────────────────────────────┬─────┤
│ APP   │ DEPLOYMENT                           │ AGE │
├───────┼──────────────────────────────────────┼─────┤
│ hello │ a4bba25b-6312-4af1-beec-447c33b8e805 │ 26s │
│ hello │ a4d4c71b-a99f-4ade-9586-640bd289158f │ 19s │
│ hello │ bc663a25-c70e-440d-b022-04a83708c616 │ 12s │
╰───────┴──────────────────────────────────────┴─────╯
╭───────────────────────────────────────────────────────╮
│ COMPONENTS                                            │
├───────┬────────────┬─────────────────┬────────────────┤
│ APP   │ DEPLOYMENT │ COMPONENT       │ REPLICA PIDS   │
├───────┼────────────┼─────────────────┼────────────────┤
│ hello │ a4bba25b   │ main            │ 695110, 695115 │
│ hello │ a4bba25b   │ hello.Reverser  │ 193720, 398751 │
│ hello │ a4d4c71b   │ main            │ 847020, 292745 │
│ hello │ a4d4c71b   │ hello.Reverser  │ 849035, 897452 │
│ hello │ bc663a25   │ main            │ 245702, 157455 │
│ hello │ bc663a25   │ hello.Reverser  │ 997520, 225023 │
╰───────┴────────────┴─────────────────┴────────────────╯
╭────────────────────────────────────────────╮
│ LISTENERS                                  │
├───────┬────────────┬──────────┬────────────┤
│ APP   │ DEPLOYMENT │ LISTENER │ ADDRESS    │
├───────┼────────────┼──────────┼────────────┤
│ hello │ a4bba25b   │ hello    │ [::]:33541 │
│ hello │ a4d4c71b   │ hello    │ [::]:41619 │
│ hello │ bc663a25   │ hello    │ [::]:33319 │
╰───────┴────────────┴──────────┴────────────╯
You can also run weaver multi dashboard to open a dashboard in a web browser.
You can add weaver.Listener fields to the component implementation to trigger
creation of network listeners (see the
Step by Step Tutorial section for context).
type app struct {
    weaver.Implements[weaver.Main]
    hello    weaver.Listener
}
When you deploy an application using weaver multi deploy, the network
listeners will be automatically created by the Service Weaver runtime.
In particular, for each listener specified in the application binary,
the runtime:
localhost:0).The proxy address is by default :0, unless a concrete address has been
specified in the multiprocess section of the config file,
e.g.:
[multi]
listeners.hello = { address = "localhost:12345" }
weaver multi deploy logs to stdout. It additionally persists all log entries in
a set of files in /tmp/serviceweaver/logs/weaver-multi. Every file contains a stream of
log entries encoded as protocol buffers. You can cat, follow, and filter these
logs using weaver multi logs. For example:
# Display all of the application logs
weaver multi logs

# Follow all of the logs (similar to tail -f).
weaver multi logs --follow

# Display all of the logs for the "todo" app.
weaver multi logs 'app == "todo"'

# Display all of the debug logs for the "todo" app.
weaver multi logs 'app=="todo" && level=="debug"'

# Display all of the logs for the "todo" app in files called foo.go.
weaver multi logs 'app=="todo" && source.contains("foo.go")'

# Display all of the logs that contain the string "error".
weaver multi logs 'msg.contains("error")'

# Display all of the logs that match a regex.
weaver multi logs 'msg.matches("error: file .* already closed")'

# Display all of the logs that have an attribute "foo" with value "bar".
weaver multi logs 'attrs["foo"] == "bar"'

# Display all of the logs in JSON format. This is useful if you want to
# perform some sort of post-processing on the logs.
weaver multi logs --format=json

# Display all of the logs, including internal system logs that are hidden by
# default.
weaver multi logs --system
Refer to weaver multi logs --help for a full explanation of the query language,
along with many more examples.
Run weaver multi dashboard to open a dashboard in a web browser. The dashboard
has a page for every Service Weaver application deployed via weaver muli deploy. Every deployment's page has a link to the deployment's
metrics. The metrics are exported in Prometheus
format and looks something like this:
# Metrics in Prometheus text format [1].
#
# To visualize and query the metrics, make sure Prometheus is installed on
# your local machine and then add the following stanza to your Prometheus yaml
# config file:
#
# scrape_configs:
# - job_name: 'prometheus-serviceweaver-scraper'
#   scrape_interval: 5s
#   metrics_path: /debug/serviceweaver/prometheus
#   static_configs:
#     - targets: ['127.0.0.1:43087']
#
#
# [1]: https://prometheus.io

# HELP example_count An example counter.
# TYPE example_count counter
example_count{serviceweaver_node="bbc9beb5"} 42
example_count{serviceweaver_node="00555c38"} 9001

# ┌─────────────────────────────────────┐
# │ SERVICEWEAVER AUTOGENERATED METRICS │
# └─────────────────────────────────────┘
# HELP serviceweaver_method_count Count of Service Weaver component method invocations
# TYPE serviceweaver_method_count counter
serviceweaver_method_count{caller="main",component="main.Example",serviceweaver_node="9fa07495",method="Foo"} 0
serviceweaver_method_count{caller="main",component="main.Example",serviceweaver_node="ee76816d",method="Foo"} 1
...
As the header explains, you can visualize and query the metrics by installing
Prometheus and configuring it, using the provided stanza, to periodically scrape
the /debug/serviceweaver/prometheus endpoint of the provided target (e.g.,
127.0.0.1:43087). You can also inspect the metrics manually. The metrics page
shows the latest value of every metric in your application followed by the
metrics that Service Weaver automatically creates for
you.
Use the weaver multi profile command to collect a profile of your Service Weaver
application. Invoke the command with the id of your deployment. For example,
imagine you weaver multi deploy your Service Weaver application and it gets a deployment
id 28807368-1101-41a3-bdcb-9625e0f02ca0.
$ weaver multi deploy weaver.toml
╭───────────────────────────────────────────────────╮
│ app        : hello                                │
│ deployment : 28807368-1101-41a3-bdcb-9625e0f02ca0 │
╰───────────────────────────────────────────────────╯
In a separate terminal, you can run the weaver multi profile command.
$ weaver multi profile 28807368               # Collect a CPU profile.
$ weaver multi profile --duration=1m 28807368 # Adjust the duration of the profile.
$ weaver multi profile --type=heap 28807368   # Collect a heap profile.
weaver multi profile prints out the filename of the collected profile. You can
use the go tool pprof command to visualize and analyze the profile. For
example:
$ profile=$(weaver multi profile <deployment>) # Collect the profile.
$ go tool pprof -http=localhost:9000 $profile # Visualize the profile.
Refer to weaver multi profile --help for more details. Refer to go tool pprof --help for more information on how to use pprof to analyze your profiles. Refer
to Profiling Go Programs for a tutorial.
Run weaver multi dashboard to open a dashboard in a web browser. The
dashboard has a page for every Service Weaver application deployed via
weaver multi deploy. Every deployment's page has a link to the deployment's
traces accessible via Perfetto. Here's an example of
what the tracing page looks like:
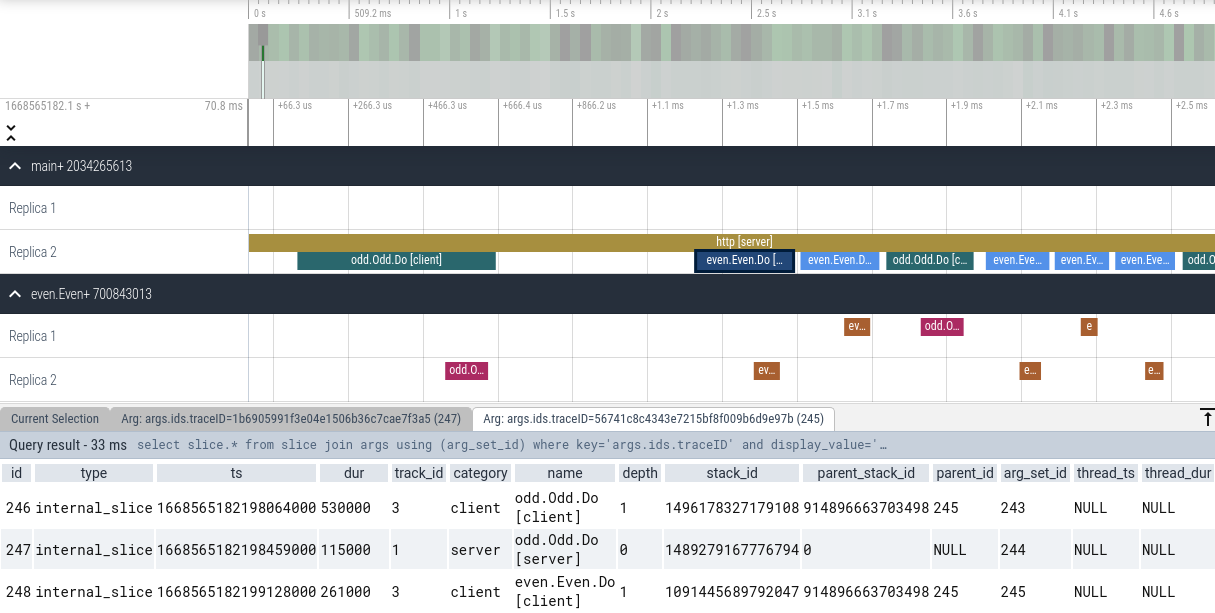
Trace events are grouped by colocation group and their corresponding replicas.
Each event has a label associated with it, based on whether the event was due to
a local or remote call. Note that the user can filter the set of events for a
particular trace by clicking on an event's traceID and choosing Find slices with the same arg value.
Refer to Perfetto UI Docs to learn more about how to use the tracing UI.
Kube is a deployer that allows you to run Service Weaver applications in any Kubernetes environment, i.e. GKE, EKS, AKS, minikube, etc.
Features:
The figure below shows a high level overview of the Kube deployer. The user
provides an application binary and a configuration file config.yaml. The deployer
builds a container image for the application, and generates Kubernetes resources that
enable the application to run in a Kubernetes cluster.
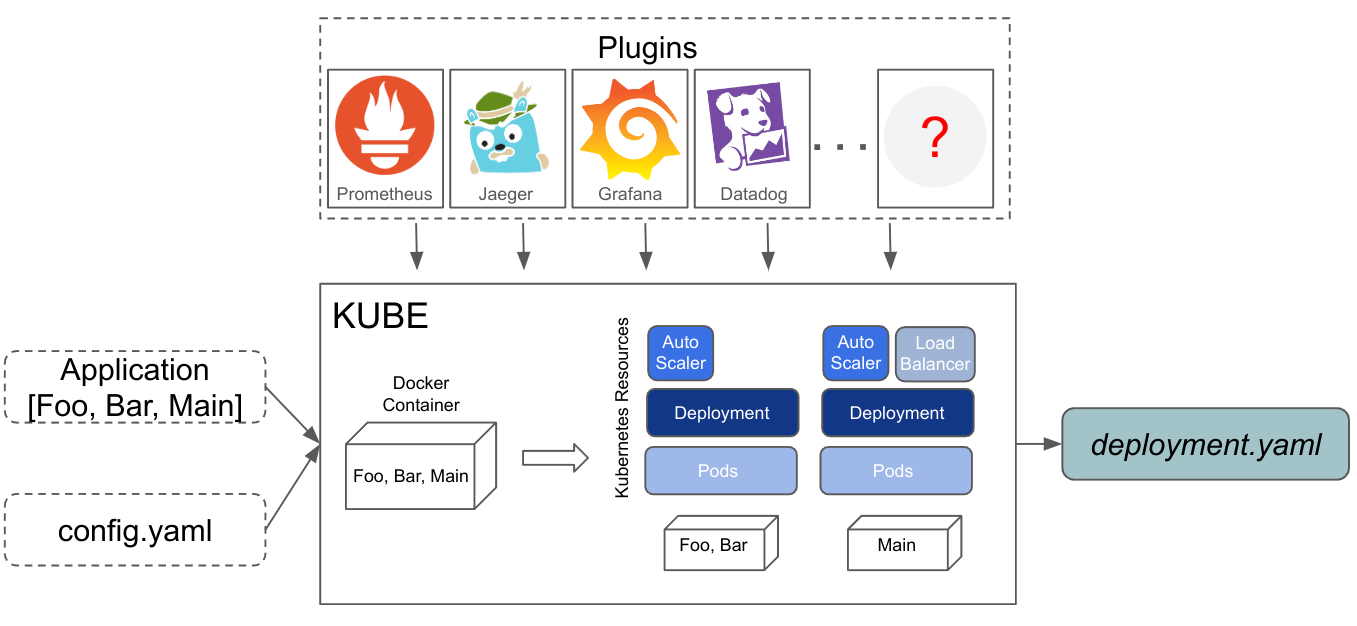
Finally, the user can use kubectl or a CI/CD pipeline to deploy the application.
$ kubectl apply -f deployment.yaml
Note that the generated Kubernetes resources encapsulate information provided by
the user in the config.yaml. For example, the user can colocate components into
groups ([Foo, Bar]), specify resource requirements for running pods, min and
max replicas, mount volumes, etc. More details on configuration options here.
By default, the Kube deployer exports logs to stdout and discards metrics
and traces. To customize how to export telemetry data, you have to use the
Kube plugin API to register plugins that contains
implementations on how to export logs, metrics, and traces. Here
is an example of how to export metrics to Prometheus and traces to
Jaeger. More details on how to write plugins here.
Note that the Kube deployer allows you to deploy a Service Weaver application
in a single region.
First, ensure you have Service Weaver installed. Next, install
Docker and kubectl. Finally, install the weaver-kube command:
$ go install github.com/ServiceWeaver/weaver-kube/cmd/weaver-kube@latest
Note: Make sure you've created a Kubernetes cluster before you attempt to
deploy using the Kube deployer.
Consider again the "Hello, World!" Service Weaver application from the Step by
Step Tutorial section. The application runs an HTTP
server on a listener named hello with a /hello?name=<name> endpoint that
returns a Hello, <name>! greeting. To deploy this application on Kubernetes, first
create a Service Weaver application config file, say weaver.toml,
with the following contents:
[serviceweaver]
binary = "./hello"
The [serviceweaver] section of the config file specifies the compiled Service
Weaver binary.
Then, create a Kube configuration file say config.yaml, with the following
contents:
appConfig: weaver.toml
repo: docker.io/mydockerid

listeners:
  - name: hello
    public: true
The Kube configuration file contains a pointer to the application config
file. It also declares the list of listeners the application should export, and
which listeners should be public, i.e., which listeners should be accessible
from the public internet. By default, all listeners are private, i.e.,
accessible only from the cluster's internal network. In our example, we declare
that thehello listener is public.
Deploy the application using weaver kube deploy:
$ go build .
$ weaver kube deploy config.yaml
...
Building image hello:ffa65856...
...
Uploading image to docker.io/mydockerid/...
...
Generating kube deployment info ...
...
kube deployment information successfully generated
/tmp/kube_ffa65856.yaml
/tmp/kube_ffa65856.yaml contains the generated Kubernetes resources for the
"Hello, World!" application.
# Listener Service for group github.com/ServiceWeaver/weaver/Main
apiVersion: v1
kind: Service
spec:
  type: LoadBalancer
...

---
# Deployment for group github.com/ServiceWeaver/weaver/Main
apiVersion: apps/v1
kind: Deployment
...

---
# Autoscaler for group github.com/ServiceWeaver/weaver/Main
apiVersion: autoscaling/v2
kind: HorizontalPodAutoscaler
...

---
# Deployment for group github.com/ServiceWeaver/weaver/examples/hello/Reverser
apiVersion: apps/v1
kind: Deployment
...

---
# Autoscaler for group github.com/ServiceWeaver/weaver/examples/hello/Reverser
apiVersion: autoscaling/v2
kind: HorizontalPodAutoscaler
...
You can simply deploy /tmp/kube_ffa65856.yaml as follows:
$ kubectl apply -f /tmp/kube_ffa65856.yaml

role.rbac.authorization.k8s.io/pods-getter created
rolebinding.rbac.authorization.k8s.io/default-pods-getter created
configmap/config-ffa65856 created
service/hello-ffa65856 created
deployment.apps/weaver-main-ffa65856-acfd658f created
horizontalpodautoscaler.autoscaling/weaver-main-ffa65856-acfd658f created
deployment.apps/hello-reverser-ffa65856-58d0b71e created
horizontalpodautoscaler.autoscaling/hello-reverser-ffa65856-58d0b71e created
To see whether your application has been deployed, you can run kubectl get all.
$ kubectl get all

NAME                                                   READY   STATUS    RESTARTS   AGE
pod/hello-reverser-ffa65856-58d0b71e-5c96fb875-zsjrb   1/1     Running   0          4m
pod/weaver-main-ffa65856-acfd658f-86684754b-w94vc      1/1     Running   0          4m

NAME                     TYPE           CLUSTER-IP       EXTERNAL-IP      PORT(S)        AGE
service/hello-ffa65856   LoadBalancer   10.103.133.111   10.103.133.111   80:30410/TCP   4m1s

NAME                                               READY   UP-TO-DATE   AVAILABLE   AGE
deployment.apps/hello-reverser-ffa65856-58d0b71e   1/1     1            1           4m1s
deployment.apps/weaver-main-ffa65856-acfd658f      1/1     1            1           4m1s

NAME                                                         DESIRED   CURRENT   READY   AGE
replicaset.apps/hello-reverser-ffa65856-58d0b71e-5c96fb875   1         1         1       4m1s
replicaset.apps/weaver-main-ffa65856-acfd658f-86684754b      1         1         1       4m1s

NAME                                                                   REFERENCE                                     TARGETS   MINPODS   MAXPODS   REPLICAS   AGE
horizontalpodautoscaler.autoscaling/hello-reverser-ffa65856-58d0b71e   Deployment/hello-reverser-ffa65856-58d0b71e    1%/80%     1         10        1        4m
horizontalpodautoscaler.autoscaling/weaver-main-ffa65856-acfd658f      Deployment/weaver-main-ffa65856-acfd658f       2%/80%     1         10        1        4m
Note that by default, the Kube deployer generates a deployment for each
component; in this example, deployments for the Main and Reverser components.
Kube configures your application to autoscale using the Kubernetes Horizontal Pod Autoscaler.
As the load on your application increases, the number of replicas of the
overloaded components will increase. Conversely, as the load on your application
decreases, the number of replicas decreases. Service Weaver can independently
scale the different components of your application, meaning that heavily loaded
components can be scaled up while lesser loaded components can simultaneously be
scaled down.
For an application running in production, you will likely want to configure DNS
to map your domain name (e.g. hello.com), to the address of the load balancer
(e.g., http://10.103.133.111). When testing and debugging an application, however,
we can also simply curl the load balancer. For example:
$ curl "http://10.103.133.111/hello?name=Weaver"
Hello, Weaver!
The /tmp/kube_ffa65856.yaml header contains more details on the generated
Kubernetes resources and how to view/delete resources. For example, to delete
the resources associated with this deployment, you can run:
$ kubectl delete all,configmaps --selector=serviceweaver/version=ffa65856
To view the application logs, you can run:
$ kubectl logs -l serviceweaver/app=hello --all-containers=true

D1107 23:39:38.096525 weavelet             643fc8a3 remoteweavelet.go:231                │ 🧶 weavelet started addr="tcp://[::]:10000"
D1107 23:39:38.097369 weavelet             643fc8a3 remoteweavelet.go:485                │ Updating components="hello.Reverser"
D1107 23:39:38.097398 weavelet             643fc8a3 remoteweavelet.go:330                │ Constructing component="hello.Reverser"
D1107 23:39:38.097438 weavelet             643fc8a3 remoteweavelet.go:336                │ Constructed component="hello.Reverser"
D1107 23:39:38.097443 weavelet             643fc8a3 remoteweavelet.go:491                │ Updated component="hello.Reverser"
D1107 23:39:37.295945 weavelet             49c6e04e remoteweavelet.go:273                │ Activated component="hello.Reverser"
D1107 23:39:38.349496 weavelet             49c6e04e remoteweavelet.go:415                │ Connecting to remote component="hello.Reverser"
D1107 23:39:38.349587 weavelet             49c6e04e remoteweavelet.go:515                │ Updated routing info addr="[tcp://10.244.2.74:10000]" component="hello.Reverser"
I1107 23:39:38.349646 weavelet             49c6e04e call.go:690                        │ connection addr="tcp://10.244.2.74:10000" from="missing" to="disconnected"
I1107 23:39:38.350108 weavelet             49c6e04e call.go:690                        │ connection addr="tcp://10.244.2.74:10000" from="disconnected" to="checking"
I1107 23:39:38.350252 weavelet             49c6e04e call.go:690                        │ connection addr="tcp://10.244.2.74:10000" from="checking" to="idle"
D1107 23:39:38.358632 weavelet             49c6e04e remoteweavelet.go:429                │ Connected to remote component="hello.Reverser"
S0101 00:00:00.000000 stdout               49c6e04e                       │ hello listener available on [::]:20000
D1107 23:39:38.360294 weavelet             49c6e04e remoteweavelet.go:336                │ Constructed component="weaver.Main"
D1107 23:39:38.360337 weavelet             49c6e04e remoteweavelet.go:491                │ Updated component="weaver.Main"
You can configure the Kube deployer using the knobs exported in the config file.
| Field | Required? | Description |
|---|---|---|
| appConfig | required | Path to the Service Weaver application config file. |
| baseImage | optional | Name of the base image used to build the application container image. If absent, the base image is ubuntu:rolling. |
| image | optional | Name of the container image Kube creates. If absent, the image name defaults to <app_name>:<app_version>. |
| buildTool | optional | Name of the tool used to build the image Kube creates. If absent, the build tool name defaults to docker. |
| repo | optional | Name of the repository where the container image is uploaded. If empty, the image is not pushed to a repository. |
| namespace | optional | Name of the Kubernetes namespace where the application should be deployed. Defaults to default. |
| serviceAccount | optional | Name of the Kubernetes service account under which to run the pods. If absent, it uses the default service account for your namespace. |
| listeners | optional | Options for the application listeners. If absent, default options will be used. |
| groups | optional | Options for groups of colocated components. If absent, each component runs in its own group. |
| resourceSpec | optional | Resource requirements needed to run the pods. Should satisfy the Kubernetes resource format. If absent, Kube will use the default resource requirements as configured by Kubernetes. |
| scalingSpec | optional | Specifications on how to scale the pods using the Kubernetes Horizontal Pod Autoscaler. Should satisfy the Kubernetes HPA spec format. If absent, default options will be used (minReplicas=1, maxReplicas=10, CPU metric, averageUtilization=80). |
| probeSpec | optional | Configure Kubernetes probes to monitor the healthiness, liveness and readiness of the pods. Should satisfy the Kubernetes probes format. If absent, no probe is configured. |
| storageSpec | optional | Options to configure Kubernetes volumes and volume mounts. If absent, no storage is configured. |
| affinitySpec | optional | Options to configure Kubernetes pod affinity. By default, it ensures that different replicas of the same service are not scheduled on the same node. |
| useHostNetwork | optional | If true, application listeners use the underlying nodes' network. This behavior is generally discouraged, but it may be useful when running the application in a minikube environment. |
| telemetry | optional | Various options how to export telemetry to your telemetry plugins. |
For more details on specific subfields of each configuration knob, please check all the configuration options.
Note: Configuration knobs such as resourceSpec, scalingSpec, storageSpec
can be configured both per deployment and per group of colocated components.
However, if a field has definitions both per deployment and per group, the Kube
deployer will consider the per group value of the field (except for the storageSpec
where it considers the concatenation of both). For example in the example below,
the Kube deployer will run two colocation groups, where the pods that run the
Reverser component require at least 256Mi memory while the pods that run the
Main component require at least 64Mi memory.
appConfig: weaver.toml
repo: docker.io/mydockerid

listeners:
- name: hello
  public: true

resourceSpec:
  requests:
    memory: "64Mi"

groups:
  - name: reverser-group
    components:
      -  github.com/ServiceWeaver/weaver/examples/hello/Reverser
    resourceSpec:
      requests:
        memory: "256Mi"
The Kube deployer allows you to customize how to export logs, metrics and
traces. To do that, you need to implement a wrapper deployer on top of the
Kube deployer using the Kube tool abstraction.
Here is an example on how we export metrics to Prometheus and traces to Jaeger.
For example, to export traces to Jaeger, you have to do the following:
$ kubectl apply -f jaeger.yaml
// ./examples/customkube
...

const jaegerPort = 14268 // Port on which the Jaeger service is receiving traces.

func main() {
  // Implementation of how to export the traces to Jaeger.
  jaegerURL := fmt.Sprintf("http://jaeger:%d/api/traces", jaegerPort)
  endpoint := jaeger.WithCollectorEndpoint(jaeger.WithEndpoint(jaegerURL))
  traceExporter, err := jaeger.New(endpoint)
  if err != nil {
    panic(err)
  }
  handleTraceSpans := func(ctx context.Context, spans []trace.ReadOnlySpan) error {
    return traceExporter.ExportSpans(ctx, spans)
  }

  // Invokes the `Kube` deployer with the plugin to export traces as instructed
  // by handleTraceSpans.
  tool.Run("customkube", tool.Plugins{
    HandleTraceSpans: handleTraceSpans,
  })
}
customkube deployer.$ go build
$ kubectl apply -f $(customkube deploy config.yaml)
The Kube deployer should integrate easily with your CI/CD pipeline.
Here is an example on how to integrate with Github Actions.
We've also tried ArgoCD and Jenkins. Please contact us on
Discord if you have issues integrating Kube with
your own CI/CD pipeline.
To roll out a new version of your application, simply rebuild your application and
run weaver kube deploy again. Once you deploy the newly generated Kubernetes resources,
it will start a new tree that runs the new application version.
Note that it is the responsibility of the user to make sure that the new application version behaves well, and the traffic is shifted to the new version.
We found out that typically the user starts the new version in the test cluster first.
Once it has enough confidence that the new version behaves as expected, it rollouts
the new version in the production cluster, and triggers an atomic rollout. You can
do this with the Kube deployer by preserving the external listener service name
across versions.
For example, if you want to do atomic rollouts across multiple versions of the
"Hello, World!" application mentioned above, you can configure the hello
listener as follows:
appConfig: weaver.toml
repo: docker.io/mydockerid

listeners:
  - name: hello
    public: true
    serviceName: uniqueServiceName
This will guarantee that every time you release a new version of the "Hello, World!"
application, the load balancer service that runs the hello listener will always
point out to the newest version of your application version.
Google Kubernetes Engine (GKE) is a Google Cloud managed service that implements the full Kubernetes API. It supports autoscaling and multi-cluster development, and allows you to run containerized applications in the cloud.
You can use weaver gke to deploy a Service Weaver application to GKE, with components
running on different machines across multiple cloud regions. The weaver gke
command does a lot of the heavy lifting to set up GKE on your behalf. It
containerizes your application; it creates the appropriate GKE clusters; it
plumbs together all the networking infrastructure; and so on. This makes
deploying your Service Weaver application to the cloud as easy as running weaver gke deploy. In this section, we show you how to deploy your application using
weaver gke. Refer to the Local GKE section to see how to simulate
a GKE deployment locally on your machine.
First, ensure you have Service Weaver installed. Next, install
the weaver-gke command:
$ go install github.com/ServiceWeaver/weaver-gke/cmd/weaver-gke@latest
Install the gcloud command to your local machine. To do so, follow these
instructions, or run the following command and follow its
prompts:
$ curl https://sdk.cloud.google.com | bash
After installing gcloud, install the required GKE authentication plugin:
$ gcloud components install gke-gcloud-auth-plugin
, and then run the following command to initialize your local environment:
$ gcloud init
The above command will prompt you to select the Google account and cloud project you wish to use. If you don't have a cloud project, the command will prompt you to create one. Make sure to select a unique project name or the command will fail. If that happens, follow these instructions to create a new project, or simply run:
$ gcloud projects create my-unique-project-name
Before you can use your cloud project, however, you must add a billing account to it. Go to this page to create a new billing account, and this page to associate a billing account with your cloud project.
Consider again the "Hello, World!" Service Weaver application from the Step by
Step Tutorial section. The application runs an HTTP
server on a listener named hello with a /hello?name=<name> endpoint that
returns a Hello, <name>! greeting. To deploy this application to GKE, first
create a Service Weaver config file, say weaver.toml, with
the following contents:
[serviceweaver]
binary = "./hello"

[gke]
regions = ["us-west1"]
listeners.hello = {is_public = true, hostname = "hello.com"}
The [serviceweaver] section of the config file specifies the compiled Service
Weaver binary. The [gke] section configures the regions where the application
is deployed (us-west1 in this example). It also declares which listeners
should be public, i.e., which listeners should be accessible from the public
internet. By default, all listeners are private, i.e., accessible only from
the cloud project's internal network. In our example, we declare that the
hello listener is public.
Note: Per RFC1035 and RFC1123, listener names should respect the following
pattern: ^(\*\.)?[a-z0-9]([-a-z0-9]*[a-z0-9])?(\.[a-z0-9]([-a-z0-9]*[a-z0-9])?)*$.
Listener names must consist of lower case alphanumeric characters or '-', and
must start and end with an alphanumeric character. No other punctuation is allowed.
All listeners deployed to GKE are configured to be health-checked by GKE
load-balancers on the /debug/weaver/healthz URL path. ServiceWeaver
automatically registers a health-check handler under this URL path in the
default ServerMux, so the hello application requires no changes.
Deploy the application using weaver gke deploy:
$ GOOS=linux GOARCH=amd64 go build
$ weaver gke deploy weaver.toml
...
Deploying the application... Done
Version "8e1c640a-d87b-4020-b3dd-4efc1850756c" of app "hello" started successfully.
Note that stopping this binary will not affect the app in any way.
Tailing the logs...
...
The first time you deploy a Service Weaver application to a cloud project, the process may be slow, since Service Weaver needs to configure your cloud project, create the appropriate GKE clusters, etc. Subsequent deployments should be significantly faster.
When weaver gke deploys your application, it creates a global, externally
accessibly load balancer that forwards traffic to the public listeners in your
application. weaver gke deploy prints out the IP address of this load balancer
as well as instructions on how to interact with it:
NOTE: The applications' public listeners will be accessible via an
L7 load-balancer managed by Service Weaver running at the public IP address:

    http://34.149.225.62

This load-balancer uses hostname-based routing to route request to the
appropriate listeners. As a result, all HTTP(s) requests reaching this
load-balancer must have the correct "Host" header field populated. This can be
achieved in one of two ways:
...
For an application running in production, you will likely want to configure DNS
to map your domain name (e.g. hello.com), to the address of the load balancer
(e.g., http://34.149.225.62). When testing and debugging an application,
however, we can also simply curl the load balancer with the appropriate hostname
header. Since we configured our application to associate host name hello.com
with the hello listener, we use the following command:
$ curl --header 'Host: hello.com' "http://34.149.225.63/hello?name=Weaver"
Hello, Weaver!
We can inspect the Service Weaver applications running on GKE using the weaver gke status command.
$ weaver gke status
╭───────────────────────────────────────────────────────────────╮
│ Deployments                                                   │
├───────┬──────────────────────────────────────┬───────┬────────┤
│ APP   │ DEPLOYMENT                           │ AGE   │ STATUS │
├───────┼──────────────────────────────────────┼───────┼────────┤
│ hello │ 20c1d756-80b5-42a7-9e73-b0d3e717516e │ 1m10s │ ACTIVE │
╰───────┴──────────────────────────────────────┴───────┴────────╯
╭──────────────────────────────────────────────────────────╮
│ COMPONENTS                                               │
├───────┬────────────┬──────────┬────────────────┬─────────┤
│ APP   │ DEPLOYMENT │ LOCATION │ COMPONENT      │ HEALTHY │
├───────┼────────────┼──────────┼────────────────┼─────────┤
│ hello │ 20c1d756   │ us-west1 │ hello.Reverser │ 2/2     │
│ hello │ 20c1d756   │ us-west1 │ main           │ 2/2     │
╰───────┴────────────┴──────────┴────────────────┴─────────╯
╭─────────────────────────────────────────────────────────────────────────────────────╮
│ TRAFFIC                                                                             │
├───────────┬────────────┬───────┬────────────┬──────────┬─────────┬──────────────────┤
│ HOST      │ VISIBILITY │ APP   │ DEPLOYMENT │ LOCATION │ ADDRESS │ TRAFFIC FRACTION │
├───────────┼────────────┼───────┼────────────┼──────────┼─────────┼──────────────────┤
│ hello.com │ public     │ hello │ 20c1d756   │ us-west1 │         │ 0.5              │
├───────────┼────────────┼───────┼────────────┼──────────┼─────────┼──────────────────┤
│ hello.com │ public     │ hello │ 20c1d756   │ us-west1 │         │ 0.5              │
╰───────────┴────────────┴───────┴────────────┴──────────┴─────────┴──────────────────╯
╭────────────────────────────╮
│ ROLLOUT OF hello           │
├─────────────────┬──────────┤
│                 │ us-west1 │
├─────────────────┼──────────┤
│ TIME            │ 20c1d756 │
│ Feb 27 21:23:07 │ 1.00     │
╰─────────────────┴──────────╯
weaver gke status reports information about every app, deployment, component,
and listener in your cloud project. In this example, we have a single deployment
(with id 20c1d756) of the hello app. Our app has two components (main and
hello.Reverser) each with two healthy replicas running in the us-west1
region. The two replicas of the main component each export a hello listener.
The global load balancer that we curled earlier balances traffic evenly across
these two listeners. The final section of the output details the rollout
schedule of the application. We'll discuss rollouts later in the
Rollouts section. You can also run weaver gke dashboard
to open a dashboard in a web browser.
Note: weaver gke configures GKE to autoscale your application. As the load
on your application increases, the number of replicas of the overloaded
components will increase. Conversely, as the load on your application decreases,
the number of replicas decreases. Service Weaver can independently scale the different
components of your application, meaning that heavily loaded components can be
scaled up while lesser loaded components can simultaneously be scaled down.
You can use the weaver gke kill command to kill your deployed application.
$ weaver gke kill hello
WARNING: You are about to kill every active deployment of the "hello" app.
The deployments will be killed immediately and irrevocably. Are you sure you
want to proceed?

Enter (y)es to continue: y
weaver gke deploy logs to stdout. It additionally exports all log entries to
Cloud Logging. You can cat, follow, and filter these logs from
the command line using weaver gke logs. For example:
# Display all of the application logs
weaver gke logs

# Follow all of the logs (similar to tail -f).
weaver gke logs --follow

# Display all of the logs for the "todo" app.
weaver gke logs 'app == "todo"'

# Display all of the debug logs for the "todo" app.
weaver gke logs 'app=="todo" && level=="debug"'

# Display all of the logs for the "todo" app in files called foo.go.
weaver gke logs 'app=="todo" && source.contains("foo.go")'

# Display all of the logs that contain the string "error".
weaver gke logs 'msg.contains("error")'

# Display all of the logs that match a regex.
weaver gke logs 'msg.matches("error: file .* already closed")'

# Display all of the logs that have an attribute "foo" with value "bar".
weaver gke logs 'attrs["foo"] == "bar"'

# Display all of the logs in JSON format. This is useful if you want to
# perform some sort of post-processing on the logs.
weaver gke logs --format=json

# Display all of the logs, including internal system logs that are hidden by
# default.
weaver gke logs --system
Refer to weaver gke logs --help for a full explanation of the query language,
along with many more examples.
You can also run weaver gke dashboard to open a dashboard in a web browser.
The dashboard has a page for every Service Weaver application deployed via
weaver gke deploy. Every deployment's page has a link to the deployment's logs
on Google Cloud's Logs Explorer as shown below.
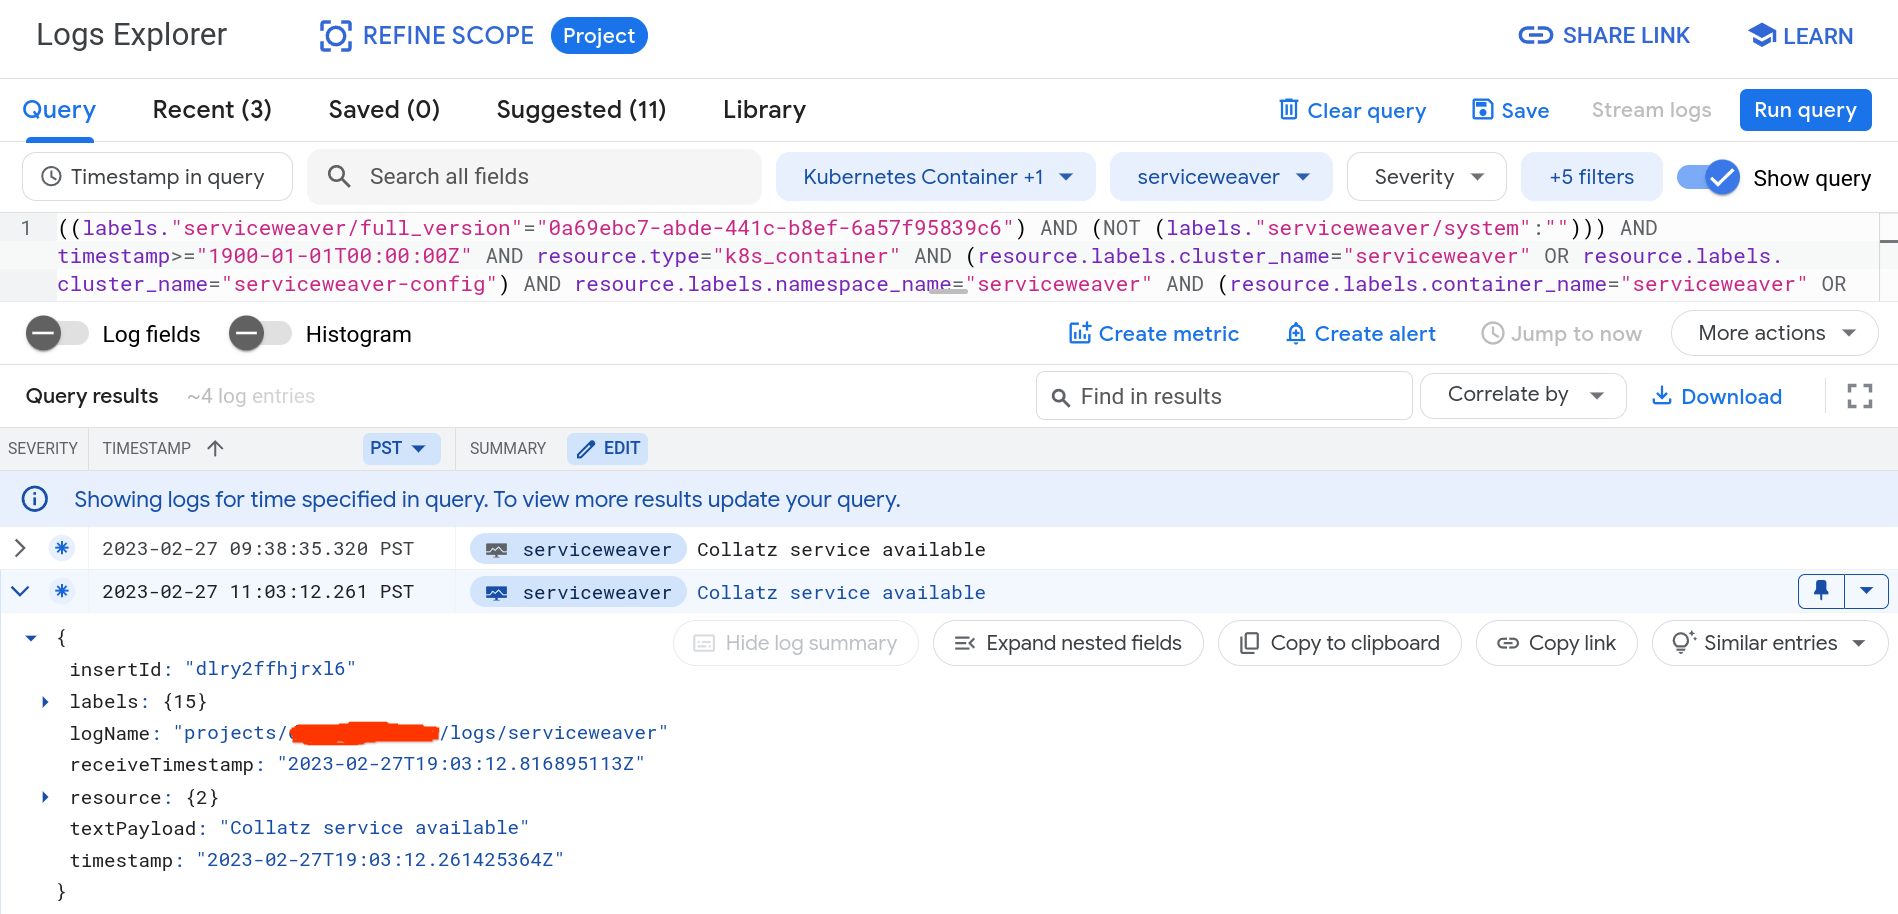
weaver gke exports metrics to the
Google Cloud Monitoring console. You can view and graph these
metrics using the Cloud Metrics Explorer. When you open the
Metrics Explorer, click SELECT A METRIC.
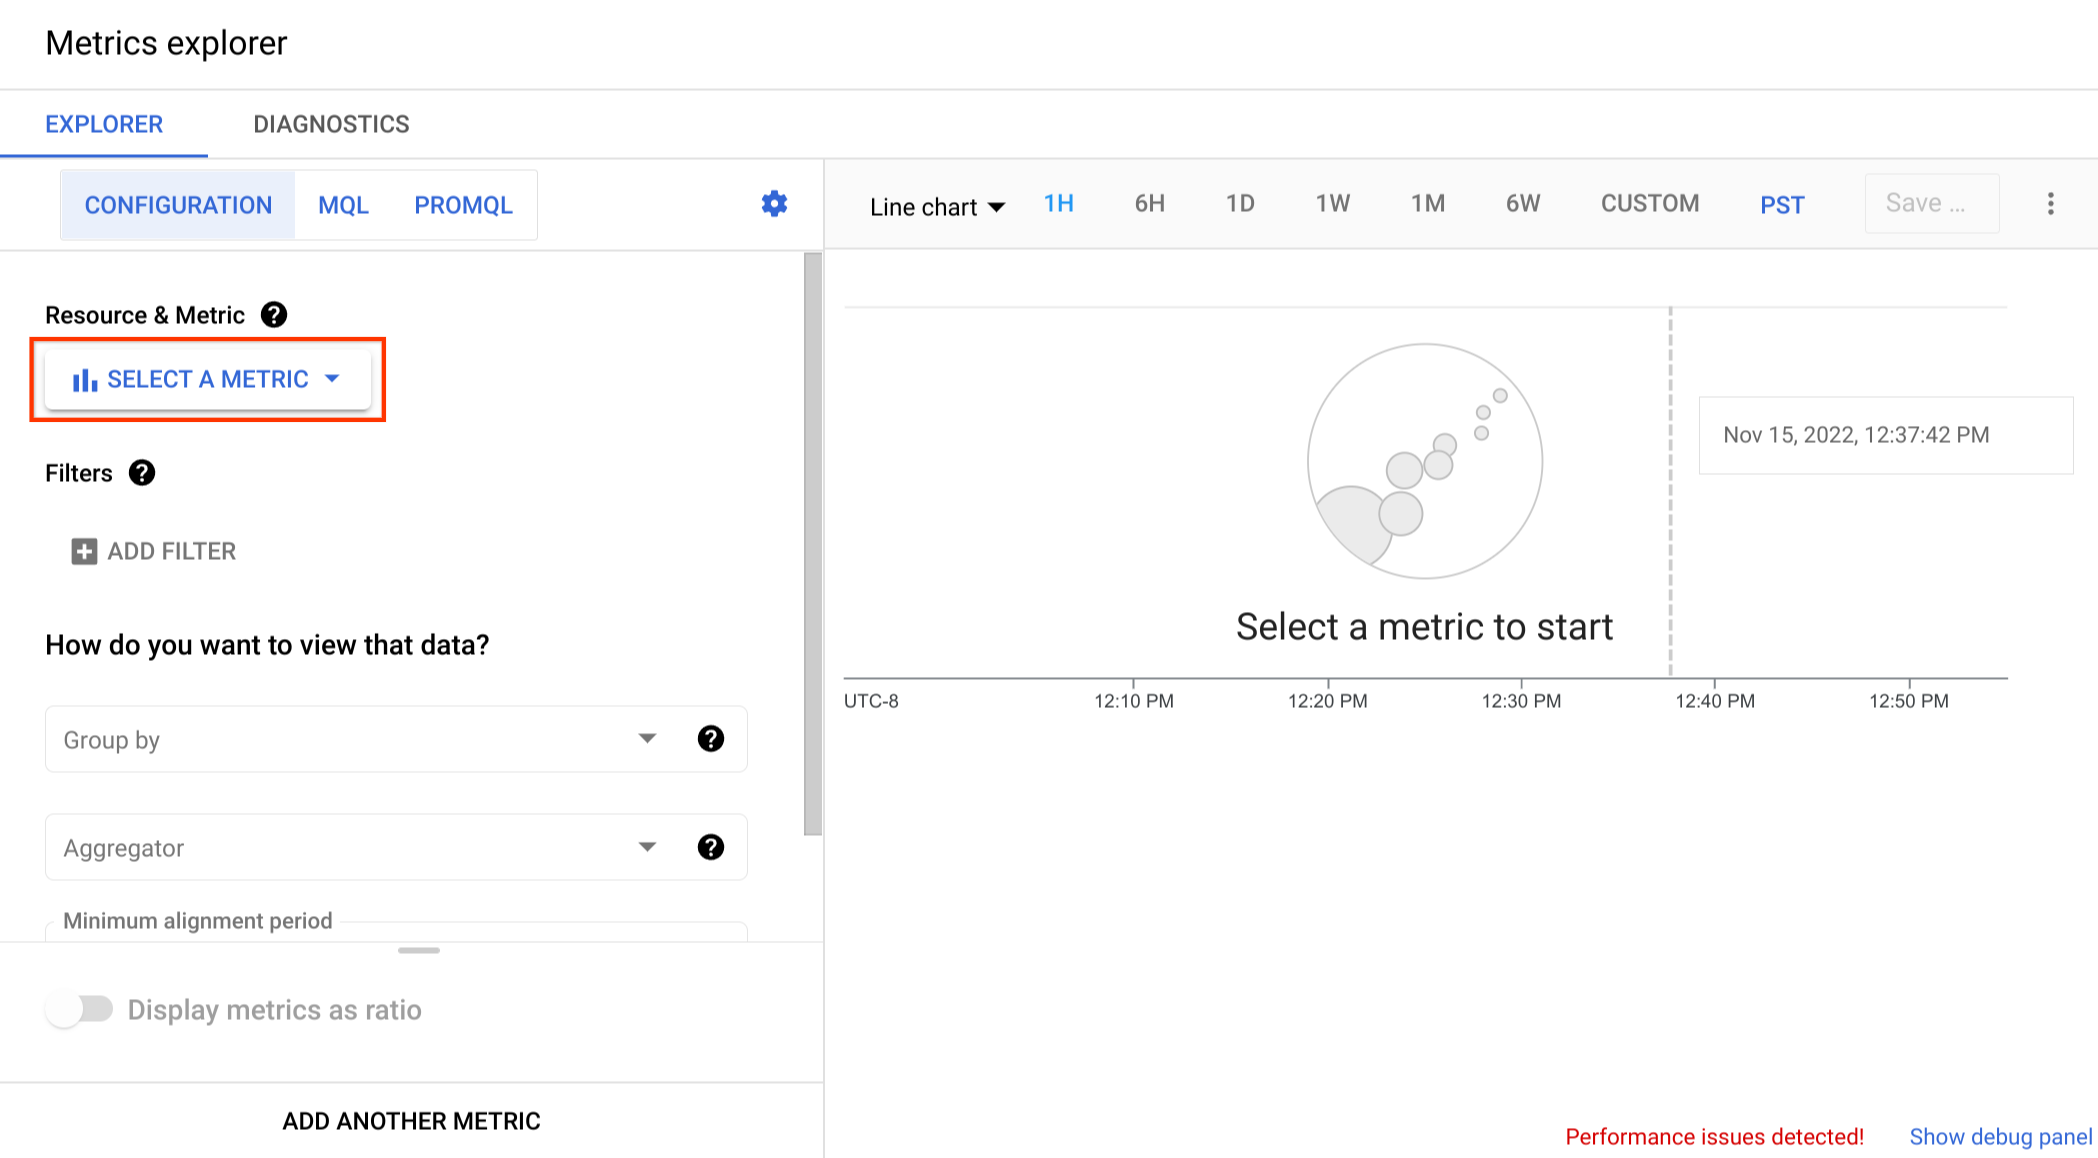
All Service Weaver metrics are exported under the custom.googleapis.com domain. Query
for serviceweaver to view these metrics and select the metric you're interested in.
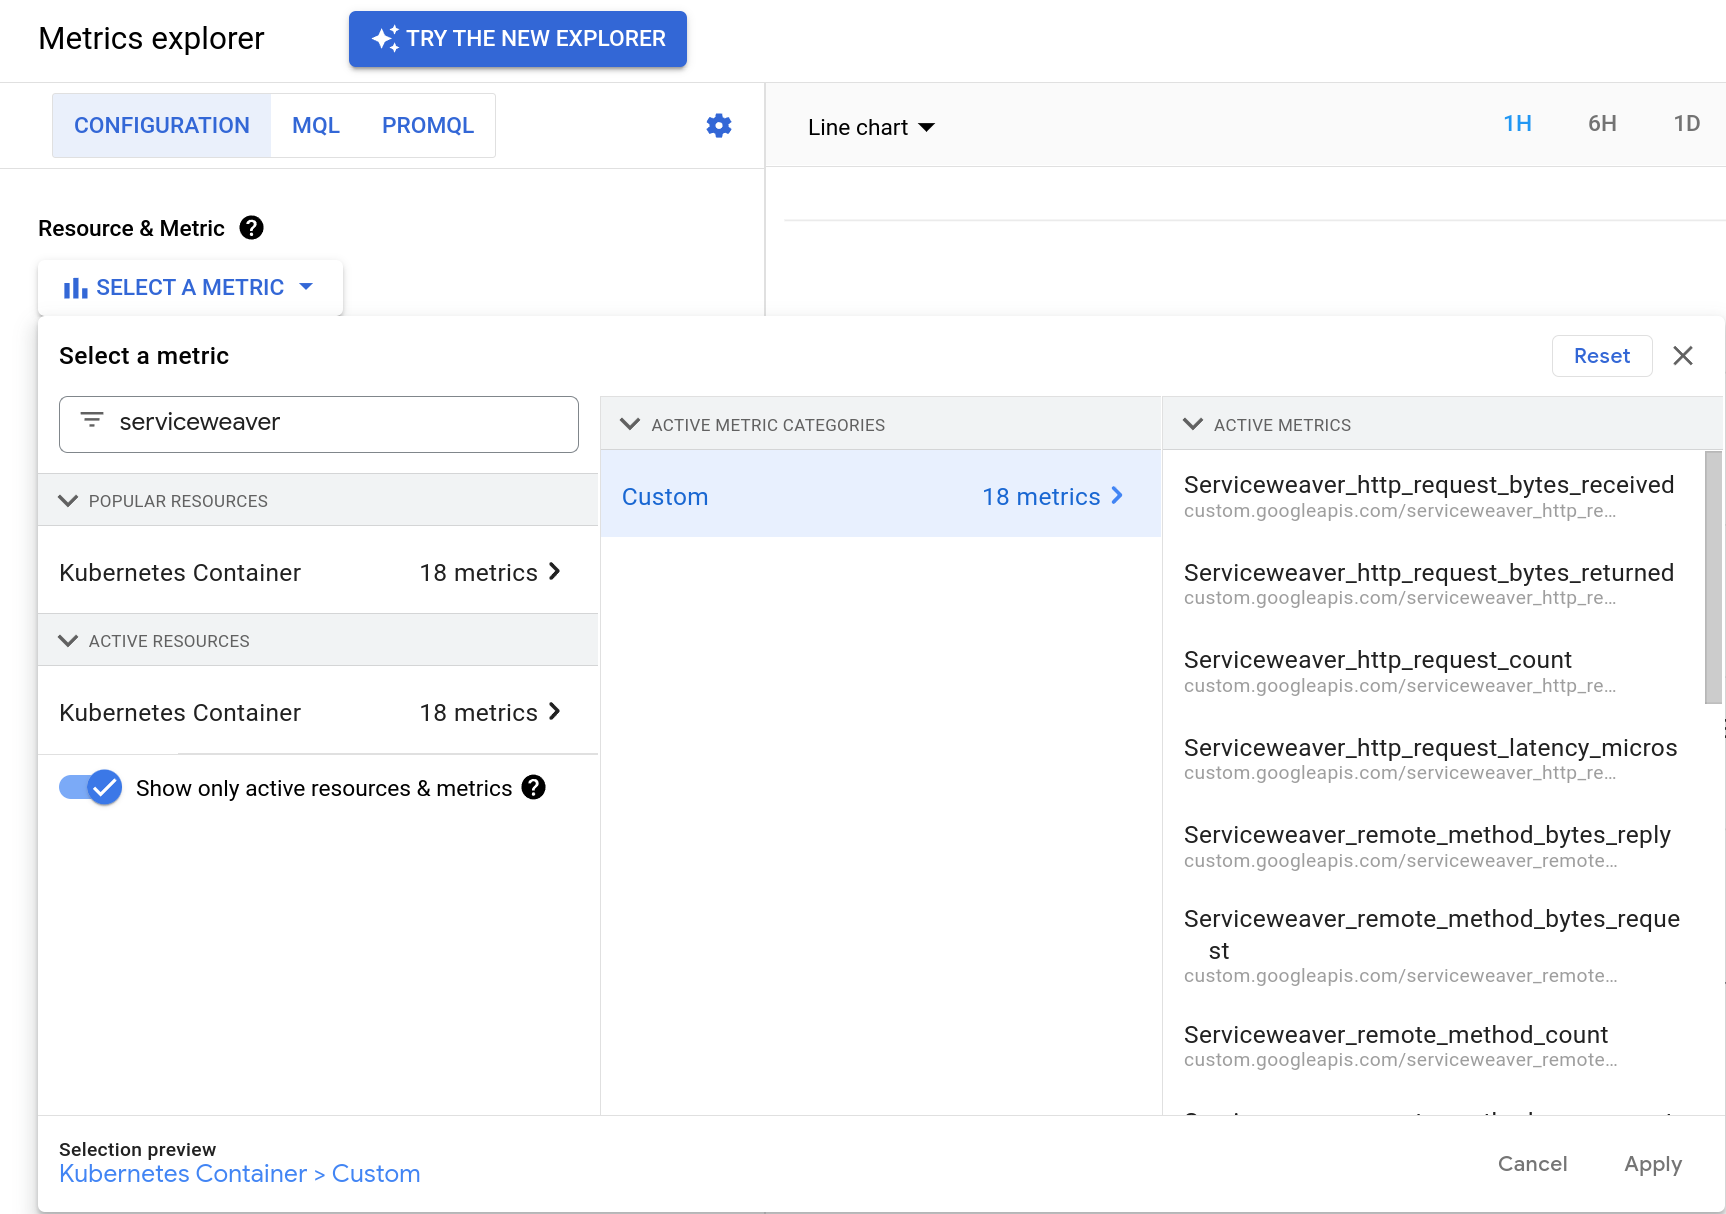
You can use the Metrics Explorer to graph the metric you selected.
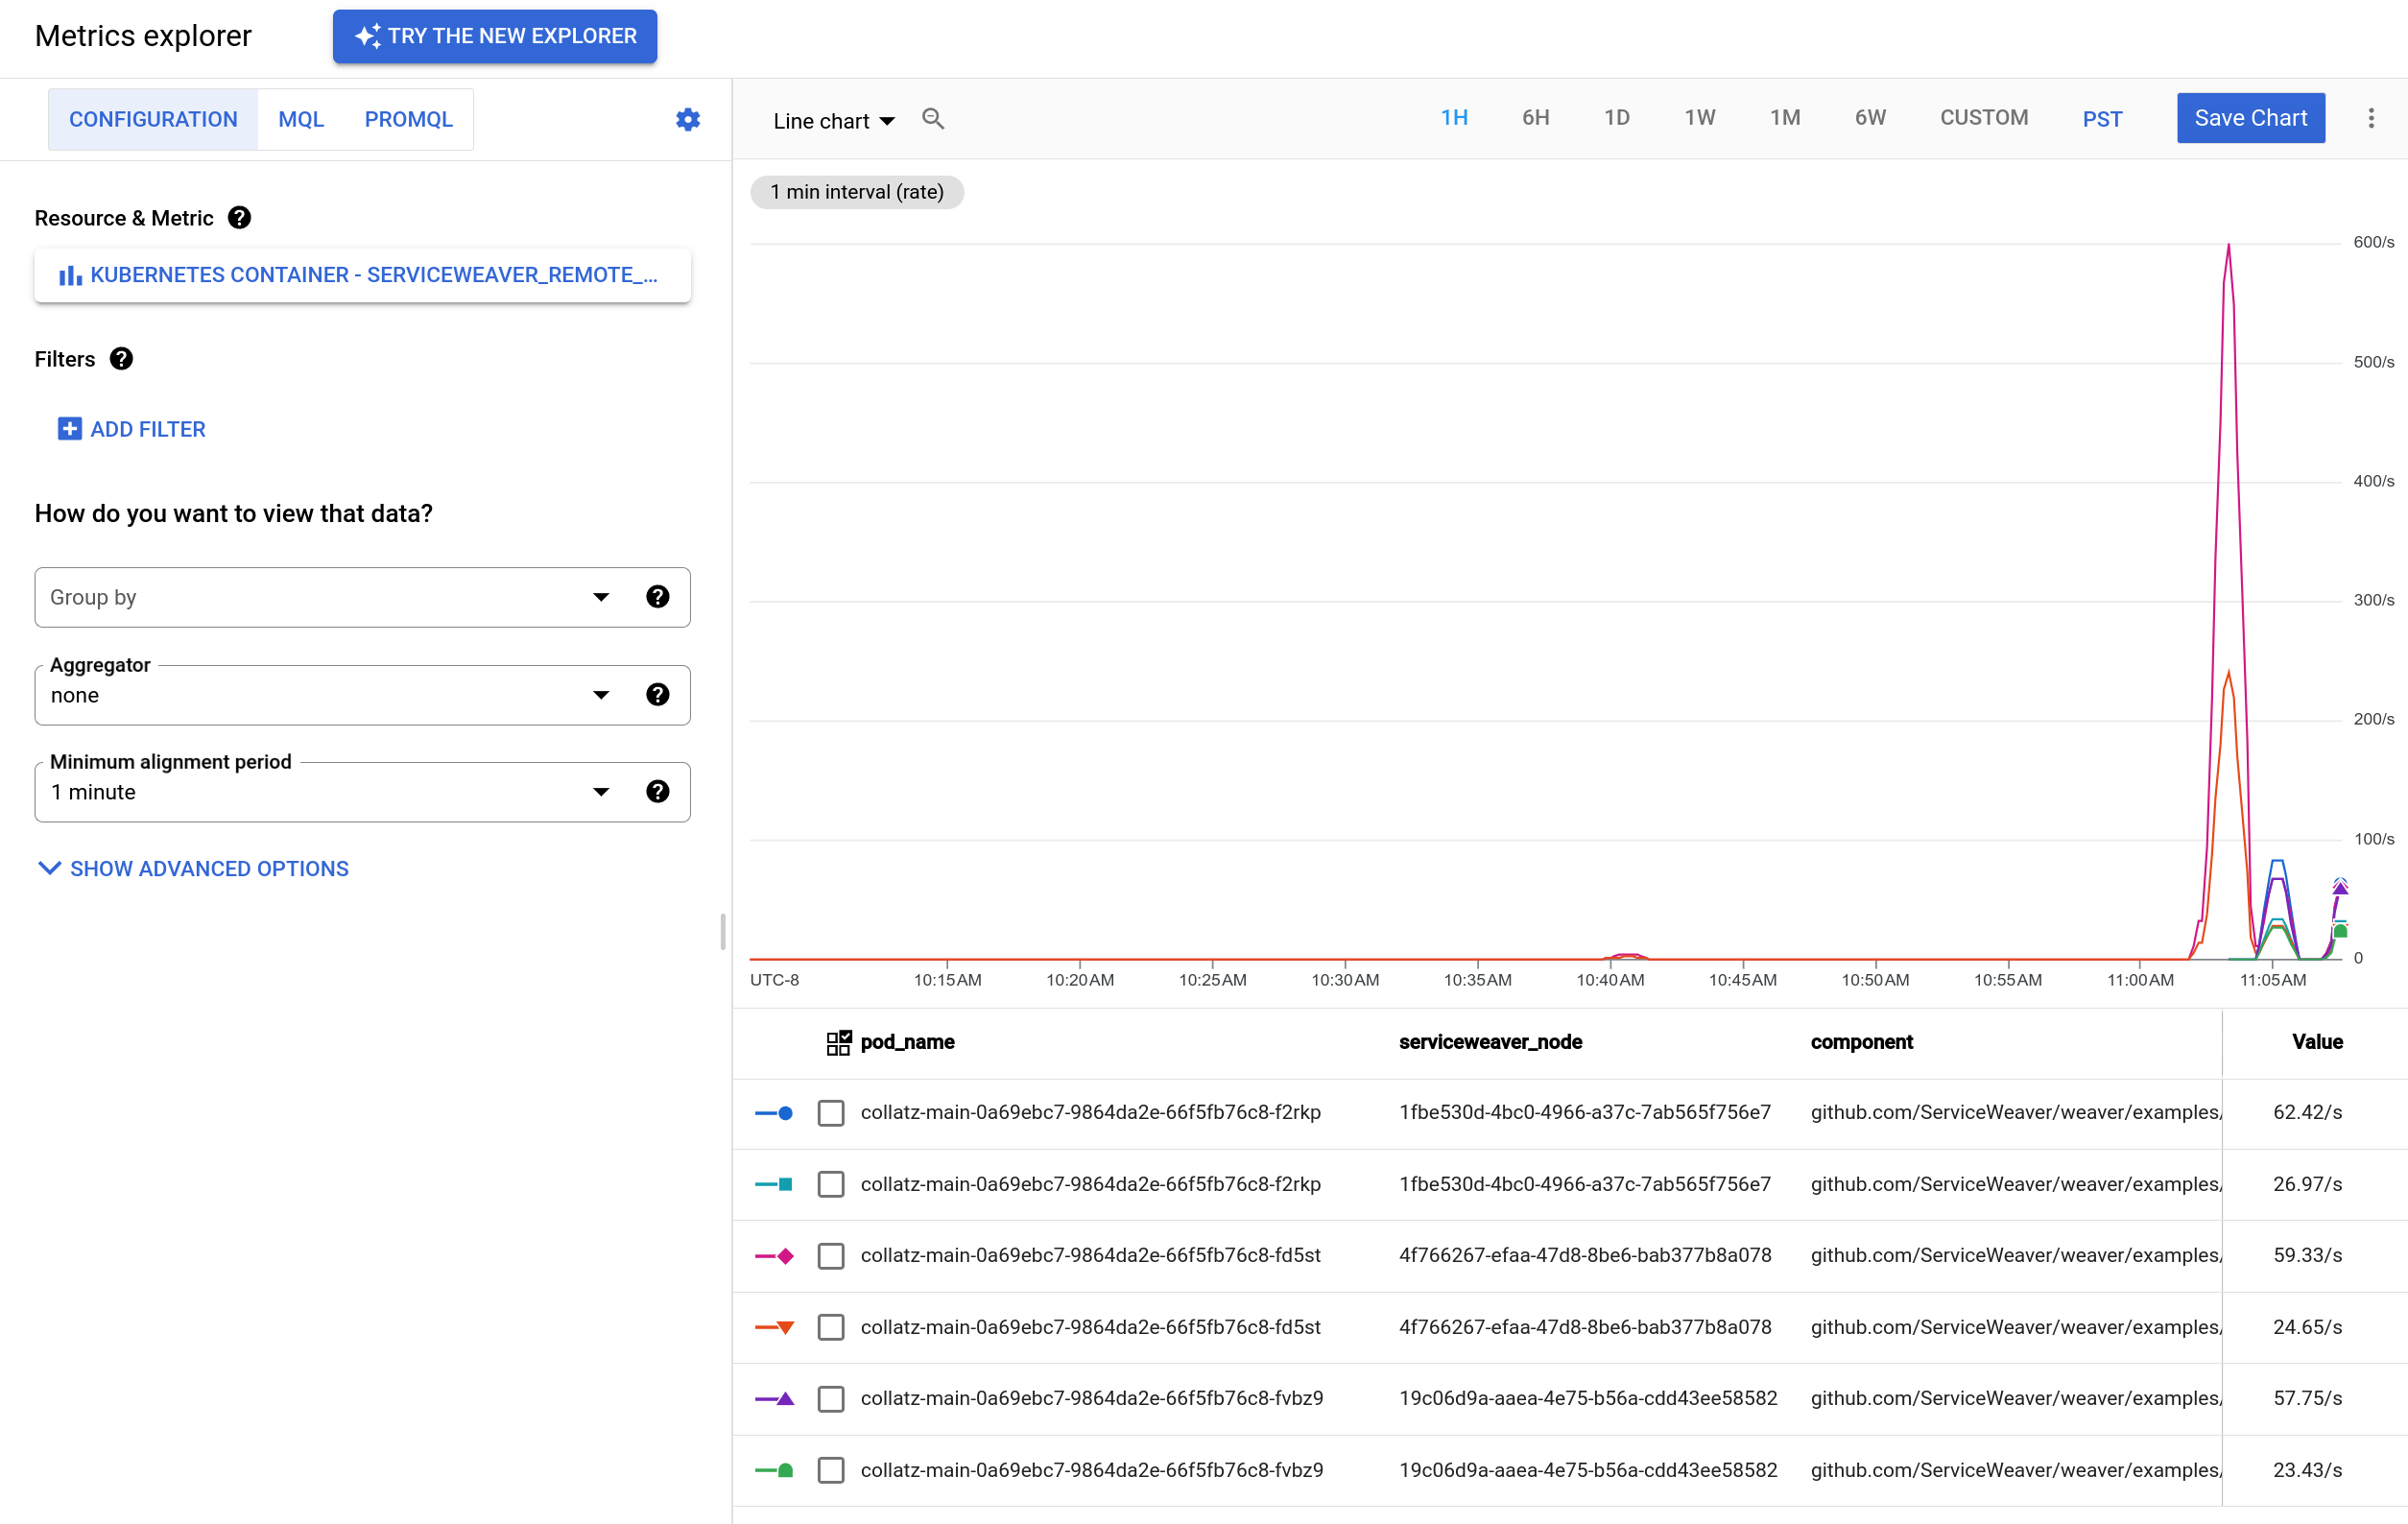
Refer to the Cloud Metrics documentation for more information.
Use the weaver gke profile command to collect a profile of your Service Weaver
application. Invoke the command with the name (and optionally version) of the
app you wish to profile. For example:
# Collect a CPU profile of the latest version of the hello app.
$ weaver gke profile hello

# Collect a CPU profile of a specific version of the hello app.
$ weaver gke profile --version=8e1c640a-d87b-4020-b3dd-4efc1850756c hello

# Adjust the duration of a CPU profile.
$ weaver gke profile --duration=1m hello

# Collect a heap profile.
$ weaver gke profile --type=heap hello
weaver gke profile prints out the filename of the collected profile. You can
use the go tool pprof command to visualize and analyze the profile. For
example:
$ profile=$(weaver gke profile <app>)         # Collect the profile.
$ go tool pprof -http=localhost:9000 $profile # Visualize the profile.
Refer to weaver gke profile --help for more details.
Run weaver gke dashboard to open a dashboard in a web browser. The
dashboard has a page for every Service Weaver application deployed via
weaver gke deploy. Every deployment's page has a link to the deployment's
traces accessible via Google Cloud Trace as shown
below.
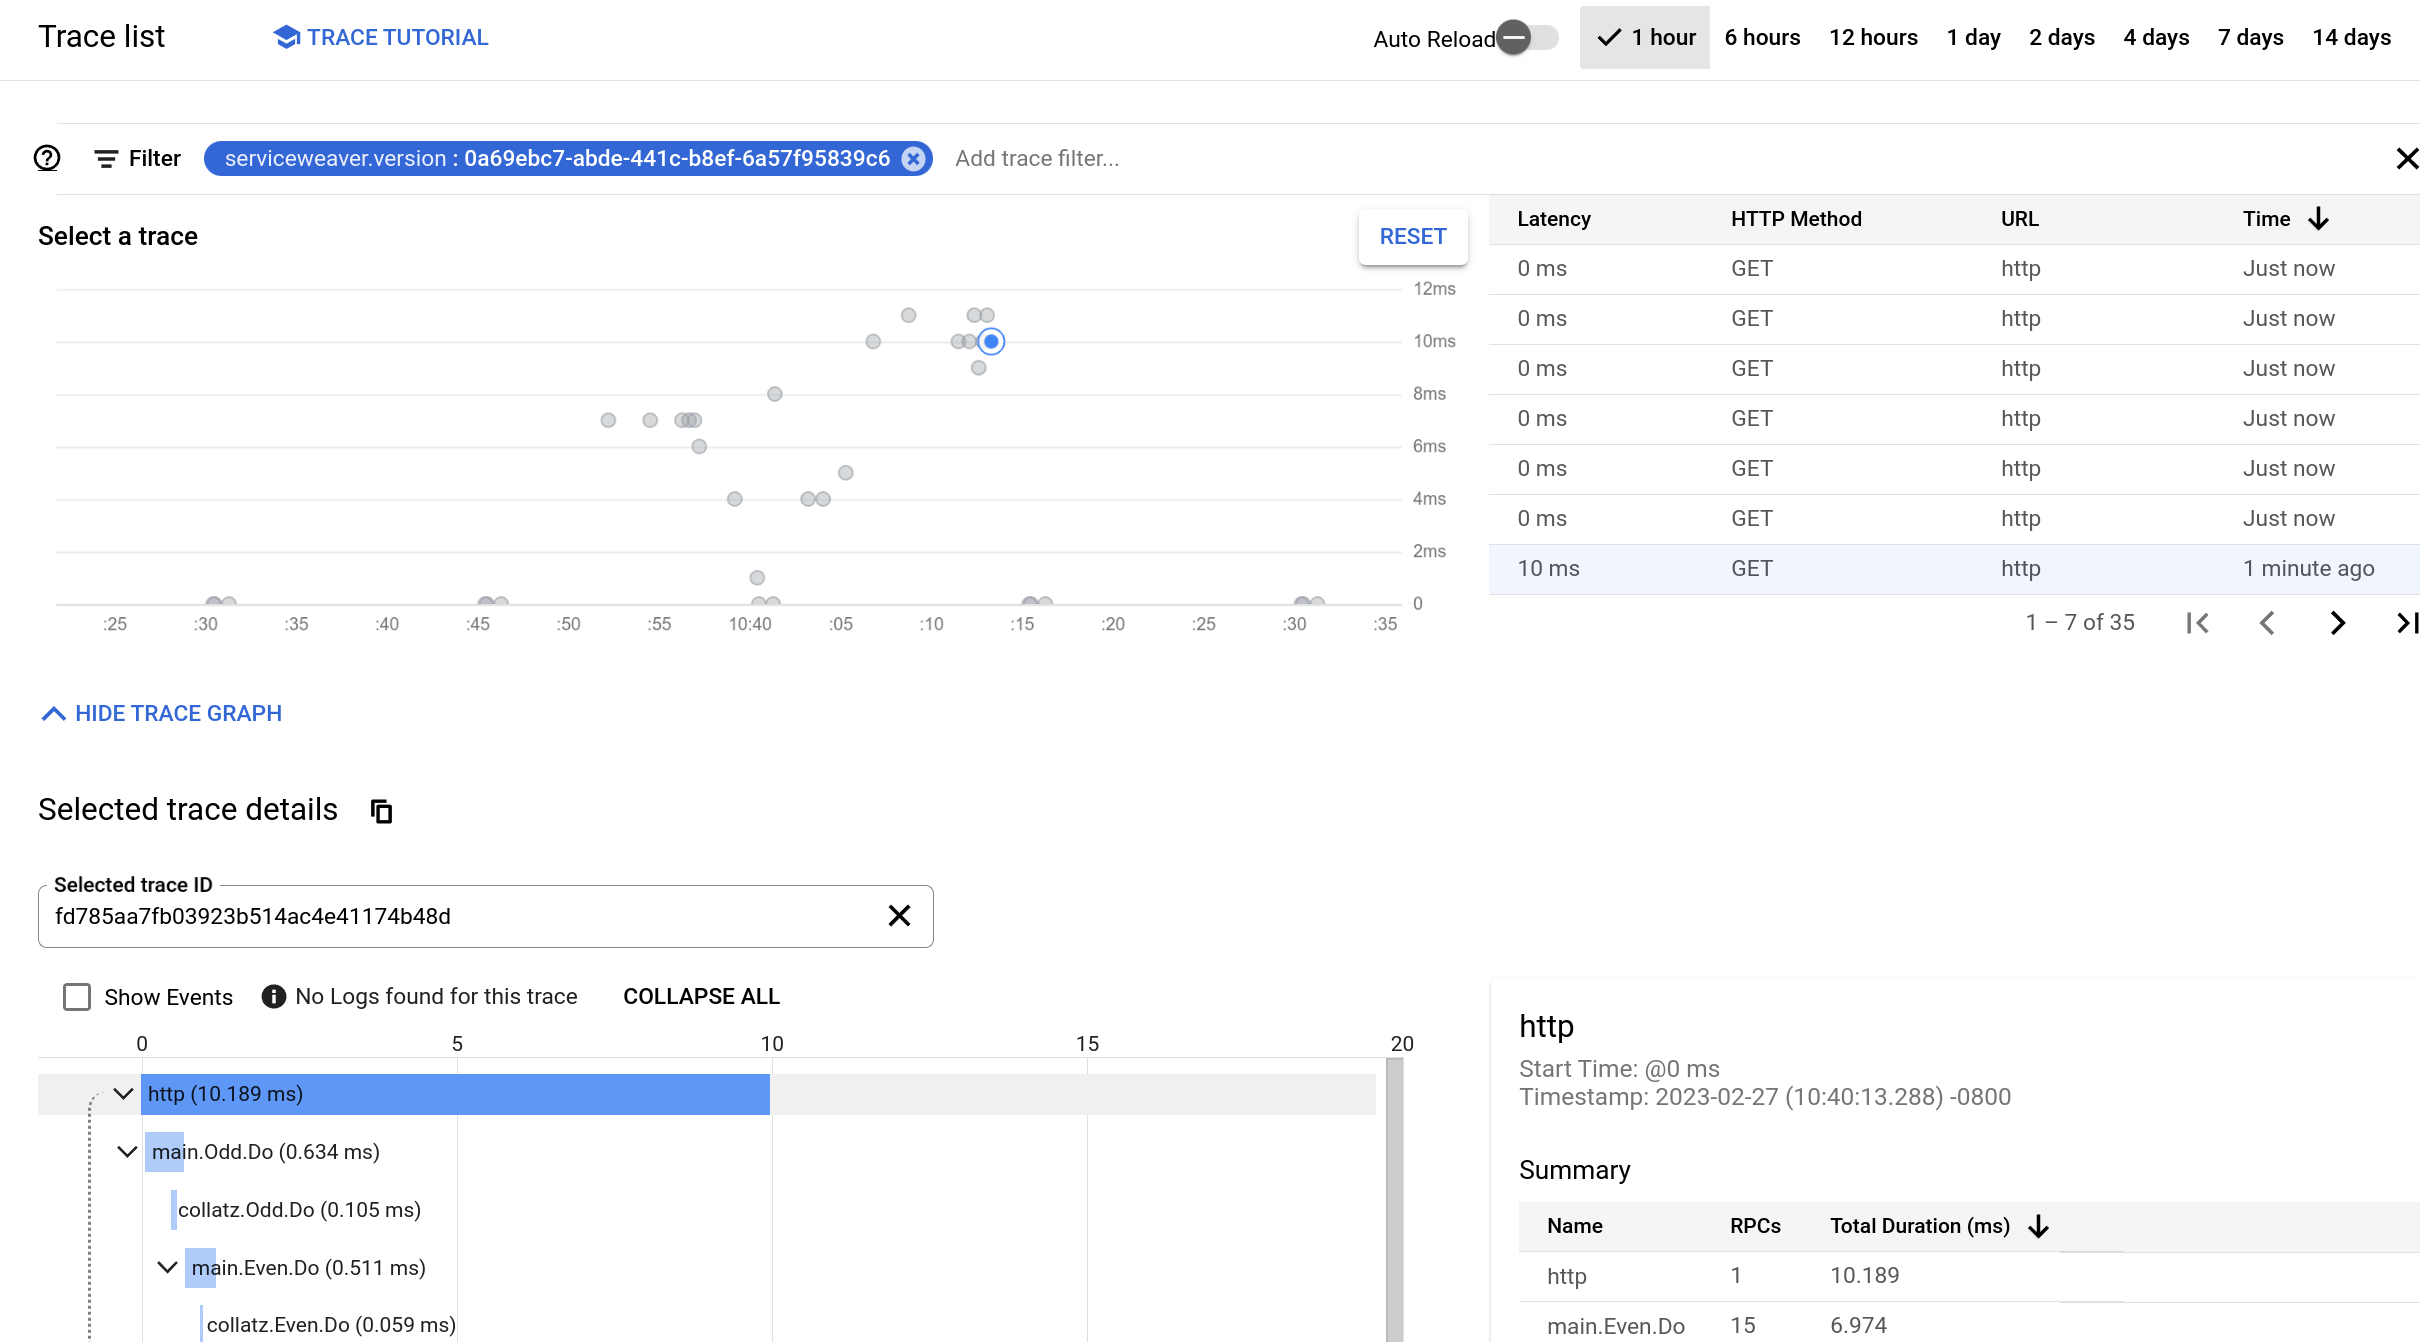
weaver gke allows you to deploy a Service Weaver application to multiple
cloud regions. Simply
include the regions where you want to deploy in your config file. For example:
[gke]
regions = ["us-west1", "us-east1", "asia-east2", "europe-north1"]
When weaver gke deploys an application to multiple regions, it intentionally
does not deploy the application to every region right away. Instead, it performs
a slow rollout of the application. weaver gke first deploys the application
to a small subset of the regions, which act as canaries. The
application runs in the canary clusters for some time before being rolled out to
a larger subset of regions. weaver gke continues this incremental
rollout---iteratively increasing the number of regions where the application is
deployed---until the application has been rolled out to every region specified
in the config file. Within each region, weaver gke also slowly shifts traffic
from old application versions to new versions. We discuss this in
the next section.
By slowly rolling out an application across regions, weaver gke allows you to
catch buggy releases early and mitigate the amount of damage they can cause. The
rollout field in a config file determines the length of a
slow rollout. For example:
[serviceweaver]
rollout = "1h" # Perform a one hour slow rollout.
...
You can monitor the rollout of an application using weaver gke status. For
example, here is the rollout schedule produced by weaver gke status for a one
hour deployment of the hello app across the us-central1, us-west1, us-south1,
and us-east1 regions.
[ROLLOUT OF hello]
                 us-west1  us-central1  us-south1  us-east1
TIME             a838cf1d  a838cf1d     a838cf1d   a838cf1d
Nov  8 22:47:30  1.00      0.00         0.00       0.00
        +15m00s  0.50      0.50         0.00       0.00
        +30m00s  0.33      0.33         0.33       0.00
        +45m00s  0.25      0.25         0.25       0.25
Every row in the schedule shows the fraction of traffic each region receives from the global load balancer. The top row is the current traffic assignment, and each subsequent row shows the projected traffic assignment at some point in the future. Noting that only regions with a deployed application receive traffic, we can see the application is initially deployed in us-west1, then slowly rolls out to us-central1, us-south1, and us-east1 in 15 minute increments.
Also note that while the global load balancer balances traffic across regions, once a request is received within a region, it is processed entirely within that region. As with slow rollouts and canarying, avoiding cross-region communication is a form of isolation that helps minimize the blast radius of a misbehaving application.
To roll out a new version of your application as a replacement of an existing
version, simply rebuild your application and run weaver gke deploy again.
weaver gke will slowly roll out the new version of the application to the
regions provided in the config file, as described in the previous section. In
addition to slowly rolling out across regions, weaver gke also slowly rolls
out within regions. Within each region, weaver gke updates the global load
balancer to slowly shift traffic from the old version of the application to the
new version.
We can again use weaver gke status to monitor the rollout of a new application
version. For example, here is the rollout schedule produced by weaver gke status for a one hour update of the hello app across the us-west1 and
us-east1 regions. The new version of the app 45a521a3 is replacing the old
version def1f485.
[ROLLOUT OF hello]
                 us-west1  us-west1  us-east1  us-east1
TIME             def1f485  45a521a3  def1f485  45a521a3
Nov  9 00:54:59  0.45      0.05      0.50      0.00
         +4m46s  0.38      0.12      0.50      0.00
         +9m34s  0.25      0.25      0.50      0.00
        +14m22s  0.12      0.38      0.50      0.00
        +19m10s  0.00      0.50      0.50      0.00
        +29m58s  0.00      0.50      0.45      0.05
        +34m46s  0.00      0.50      0.38      0.12
        +39m34s  0.00      0.50      0.25      0.25
        +44m22s  0.00      0.50      0.12      0.38
        +49m10s  0.00      0.50      0.00      0.50
Every row in the schedule shows the fraction of traffic that every deployment receives in every region. The schedule shows that the new application is rolled out in us-west1 before us-east1. Initially, the new version receives increasingly more traffic in the us-west1 region, transitioning from 5% of the global traffic (10% of the us-west1 traffic) to 50% of the global traffic (100% of the us-west1 traffic) over the course of roughly 20 minutes. Ten minutes later, this process repeats in us-east1 over the course of another 20 minutes until the new version is receiving 100% of the global traffic. After the full one hour rollout is complete, the old version is considered obsolete and is deleted automatically.
Note: While the load balancer balances traffic across application versions, once a request is received, it is processed entirely by the version that received it. There is no cross-version communication.
Superficially, weaver gke's rollout scheme seems to require a lot of resources
because it runs two copies of the application side-by-side. In reality,
weaver gke's use of autoscaling makes this type of
blue/green rollout resource efficient. As traffic is shifted away
from the old version, its load decreases, and the autoscaler reduces its
resource allocation. Simultaneously, as the new version receives more traffic,
its load increases, and the autoscaler begins to increase its resource
allocation. These two transitions cancel out causing the rollout to use a
roughly constant number of resources.
You can configure weaver gke using the [gke] section of a
config file.
[gke]
regions = ["us-west1", "us-east1"]
listeners.cat = {is_public = true, hostname = "cat.com"}
listeners.hat = {is_public = true, hostname = "hat.gg"}
| Field | Required? | Description |
|---|---|---|
| regions | yes | Regions in which the Service Weaver application should be deployed. Note that at least one region should be specified. |
| image | optional | Base image used to build the application container image. If not specified, image = ubuntu:rolling. |
| minreplicas | optional | Minimum number of running pods for each component. If not specified, minreplicas = 1. |
| listeners | optional | The application's listener options, e.g., the listeners' hostnames. |
| telemetry | optional | Various options how to export telemetry. |
Note that by default, your Service Weaver application will be deployed in the
currently active project using the currently active account; i.e., in the project
returned by running the gcloud config get-value project command, and using the
account returned by running the gcloud config get-value account command.
If you want to deploy in a different project then you should pass the name of the new Google Cloud project as a flag when deploying your application:
$ weaver gke deploy --project=new_project_name weaver.toml
If you want to deploy using a different account then you should pass the name of the new Google Cloud Account as a flag when deploying your application:
$ weaver gke deploy --account=new_account_name weaver.toml
You can configure how to export the metrics; in particular, how often to export
metrics to Google Cloud Monitoring, and whether the framework should
export the auto-generated metrics. For example,
to export the metrics every 1 hour, and also export the auto-generated metrics,
you can add the following configuration:
[gke]
regions = ["us-west1", "us-east1"]
...
telemetry.metrics = {export_interval = "1h", auto_generate_metrics = true}
By default, Service Weaver doesn't export the auto-generated metrics, and it exports
the user defined metrics every 30 seconds.
You can also configure the minimum log level for a log entry to be exported to the
Google Cloud Logging. For example, to export only log entries that
are WARN or ERROR, you can add the following configuration:
[gke]
regions = ["us-west1", "us-east1"]
...
telemetry.logging = {min_export_level = "WARN"}
Note that min_export_level takes log level values defined by slog.
If not specified, Service Weaver exports all logs (min_export_level = "DEBUG").
weaver gke lets you deploy Service Weaver applications to GKE. weaver gke-local
is a drop-in replacement for weaver gke that allows you to simulate GKE
deployments locally on your machine. Every weaver gke command can be replaced
with an equivalent weaver gke-local command. weaver gke deploy becomes
weaver gke-local deploy; weaver gke status becomes weaver gke-local status;
and so on. weaver gke-local runs your components in simulated GKE clusters and
launches a local proxy to emulate GKE's global load balancer. weaver gke-local
also uses the same config as a weaver gke, meaning that after you
test your application locally using weaver gke-local, you can deploy the same
application to GKE without any code or config changes.
First, ensure you have Service Weaver installed. Next, install
the weaver-gke-local command:
$ go install github.com/ServiceWeaver/weaver-gke/cmd/weaver-gke-local@latest
In the weaver gke section, we deployed a "Hello,
World!" application to GKE using weaver gke deploy. We can deploy the same app
locally using weaver gke-local deploy:
$ cat weaver.toml
[serviceweaver]
binary = "./hello"

[gke]
regions = ["us-west1"]
listeners.hello = {is_public = true, hostname = "hello.com"}

$ weaver gke-local deploy weaver.toml
Deploying the application... Done
Version "a2bc7a7a-fcf6-45df-91fe-6e6af171885d" of app "hello" started successfully.
Note that stopping this binary will not affect the app in any way.
Tailing the logs...
...
You can run weaver gke-local status to check the status of all the applications
deployed using weaver gke-local.
$ weaver gke-local status
╭─────────────────────────────────────────────────────────────╮
│ Deployments                                                 │
├───────┬──────────────────────────────────────┬─────┬────────┤
│ APP   │ DEPLOYMENT                           │ AGE │ STATUS │
├───────┼──────────────────────────────────────┼─────┼────────┤
│ hello │ af09030c-b3a6-4d15-ba47-cd9e9e9ec2e7 │ 13s │ ACTIVE │
╰───────┴──────────────────────────────────────┴─────┴────────╯
╭──────────────────────────────────────────────────────────╮
│ COMPONENTS                                               │
├───────┬────────────┬──────────┬────────────────┬─────────┤
│ APP   │ DEPLOYMENT │ LOCATION │ COMPONENT      │ HEALTHY │
├───────┼────────────┼──────────┼────────────────┼─────────┤
│ hello │ af09030c   │ us-west1 │ hello.Reverser │ 2/2     │
│ hello │ af09030c   │ us-west1 │ main           │ 2/2     │
╰───────┴────────────┴──────────┴────────────────┴─────────╯
╭─────────────────────────────────────────────────────────────────────────────────────────────╮
│ TRAFFIC                                                                                     │
├───────────┬────────────┬───────┬────────────┬──────────┬─────────────────┬──────────────────┤
│ HOST      │ VISIBILITY │ APP   │ DEPLOYMENT │ LOCATION │ ADDRESS         │ TRAFFIC FRACTION │
├───────────┼────────────┼───────┼────────────┼──────────┼─────────────────┼──────────────────┤
│ hello.com │ public     │ hello │ af09030c   │ us-west1 │ 127.0.0.1:46539 │ 0.5              │
│ hello.com │ public     │ hello │ af09030c   │ us-west1 │ 127.0.0.1:43439 │ 0.5              │
╰───────────┴────────────┴───────┴────────────┴──────────┴─────────────────┴──────────────────╯
╭────────────────────────────╮
│ ROLLOUT OF hello           │
├─────────────────┬──────────┤
│                 │ us-west1 │
├─────────────────┼──────────┤
│ TIME            │ af09030c │
│ Feb 27 20:33:10 │ 1.00     │
╰─────────────────┴──────────╯
The output is, unsurprisingly, identical to that of weaver gke status. There is
information about every app, component, and listener. Note that for this
example, weaver gke-local is running the "Hello, World!" application in a fake
us-west1 "region", as specified in the weaver.toml config file.
weaver gke-local runs a proxy on port 8000 that simulates the global load
balancer used by weaver gke. We can curl the proxy in the same way we curled
the global load balancer. Since we configured our application to associate host
name hello.com with the hello listener, we use the following command:
$ curl --header 'Host: hello.com' "localhost:8000/hello?name=Weaver"
Hello, Weaver!
You can use the weaver gke-local kill command to kill your deployed
application.
$ weaver gke-local kill hello
WARNING: You are about to kill every active deployment of the "hello" app.
The deployments will be killed immediately and irrevocably. Are you sure you
want to proceed?

Enter (y)es to continue: y
weaver gke-local deploy logs to stdout. It additionally persists all log
entries in a set of files in /tmp/serviceweaver/logs/weaver-gke-local. Every file
contains a stream of log entries encoded as protocol buffers. You can cat,
follow, and filter these logs using weaver gke-local logs. For example:
# Display all of the application logs
weaver gke-local logs

# Follow all of the logs (similar to tail -f).
weaver gke-local logs --follow

# Display all of the logs for the "todo" app.
weaver gke-local logs 'app == "todo"'

# Display all of the debug logs for the "todo" app.
weaver gke-local logs 'app=="todo" && level=="debug"'

# Display all of the logs for the "todo" app in files called foo.go.
weaver gke-local logs 'app=="todo" && source.contains("foo.go")'

# Display all of the logs that contain the string "error".
weaver gke-local logs 'msg.contains("error")'

# Display all of the logs that match a regex.
weaver gke-local logs 'msg.matches("error: file .* already closed")'

# Display all of the logs that have an attribute "foo" with value "bar".
weaver gke-local logs 'attrs["foo"] == "bar"'

# Display all of the logs in JSON format. This is useful if you want to
# perform some sort of post-processing on the logs.
weaver gke-local logs --format=json

# Display all of the logs, including internal system logs that are hidden by
# default.
weaver gke-local logs --system
Refer to weaver gke-local logs --help for a full explanation of the query
language, along with many more examples.
In addition to running the proxy on port 8000 (see the Getting
Started), weaver gke-local also runs a status
server on port 8001. This server's /metrics endpoint exports the metrics of
all running Service Weaver applications in Prometheus format,
which looks like this:
# HELP example_count An example counter.
# TYPE example_count counter
example_count{serviceweaver_node="bbc9beb5"} 42
example_count{serviceweaver_node="00555c38"} 9001
To visualize and query the metrics, make sure Prometheus is installed on your local machine and then add the following stanza to your Prometheus yaml config file:
scrape_configs:
- job_name: 'prometheus-serviceweaver-scraper'
  scrape_interval: 5s
  metrics_path: /metrics
  static_configs:
    - targets: ['localhost:8001']
Use the weaver gke-local profile command to collect a profile of your Service Weaver
application. Invoke the command with the name (and optionally version) of the
app you wish to profile. For example:
# Collect a CPU profile of the latest version of the hello app.
$ weaver gke-local profile hello

# Collect a CPU profile of a specific version of the hello app.
$ weaver gke-local profile --version=8e1c640a-d87b-4020-b3dd-4efc1850756c hello

# Adjust the duration of a CPU profile.
$ weaver gke-local profile --duration=1m hello

# Collect a heap profile.
$ weaver gke-local profile --type=heap hello
weaver gke-local profile prints out the filename of the collected profile. You
can use the go tool pprof command to visualize and analyze the profile. For
example:
$ profile=$(weaver gke-local profile <app>)    # Collect the profile.
$ go tool pprof -http=localhost:9000 $profile # Visualize the profile.
Refer to weaver gke-local profile --help for more details.
Run weaver gke-local dashboard to open a dashboard in a web browser. The
dashboard has a page for every Service Weaver application deployed via
weaver gke-local deploy. Every deployment's page has a link to the
deployment's traces accessible via Perfetto. Here's an
example of what the tracing page looks like:
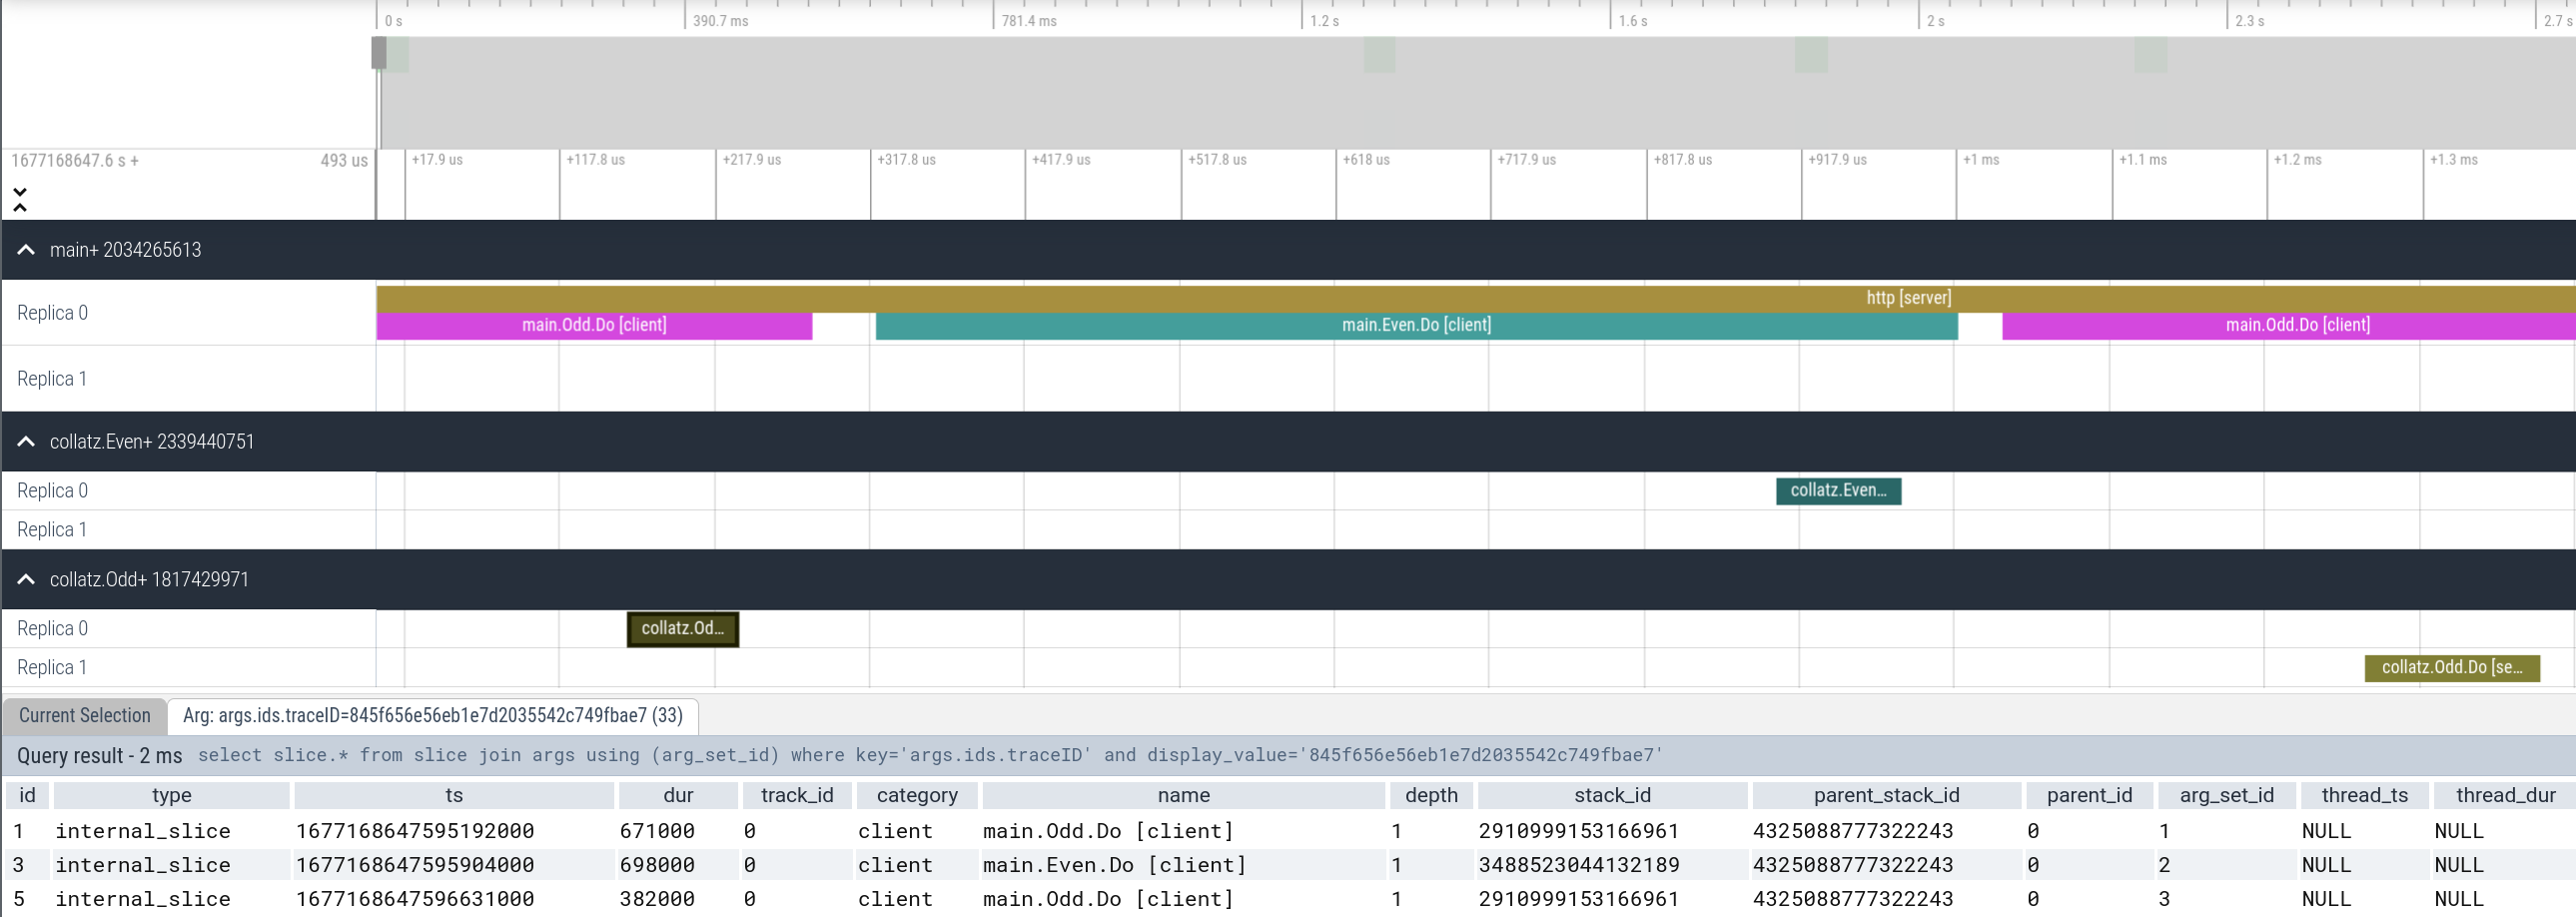
Refer to Perfetto UI Docs to learn more about how to use the tracing UI.
Recall that weaver gke performs slow rollouts
across regions and
across application versions. weaver gke-local simulates this
behavior locally. When you weaver gke-local deploy an application, the
application is first rolled out to a number of canary regions before being
slowly rolled out to all regions. And within a region, the locally running proxy
slowly shifts traffic from old versions of the application to the new version of
the application. You can use weaver gke-local status, exactly like how you use
weaver gke status, to monitor the rollouts of your applications.
Cloud Run is a Google Cloud managed compute platform that enables you to run stateless containers that are invocable via HTTP requests.
We provide instructions on how to run a Service Weaver application in a single container on Cloud Run.
First, you should create a Docker container and upload it to Google Artifact Registry:
$ docker build -t REGION-docker.pkg.dev/PROJECT_ID/REPO_NAME/PATH:TAG .
$ docker push REGION-docker.pkg.dev/PROJECT_ID/REPO_NAME/PATH:TAG
These instructions contain more details on how to build a container to run on Cloud Run.
Next, deploy the container to Cloud Run using gcloud run deploy:
$ gcloud run deploy NAME --image=REGION-docker.pkg.dev/PROJECT_ID/REPO_NAME/PATH:TAG --region=REGION --allow-unauthenticated
This command should print out a URL that you can use to access the service. Alternatively, you can curl the service from the command line:
$ curl -H "Authorization: Bearer $(gcloud auth print-identity-token)" URL
This repository contains an example of a Service Weaver application that can run on Cloud Run.
SSH is a deployer that allows you to run Service Weaver applications on
a set of machines reachable via ssh. Note that the SSH deployer runs your
application's components as standalone OS processes, so you don't need
Kubernetes, Docker, etc.
Prerequisites:
ssh.ssh between your machines, otherwise you
will have to type the password for each machine when you deploy/stop an application.Consider again the "Hello, World!" Service Weaver application from the Step by
Step Tutorial section. The application runs an HTTP
server on a listener named hello with a /hello?name=<name> endpoint that
returns a Hello, <name>! greeting. To deploy this application using the SSH
deployer, first create a Service Weaver application config file,
say weaver.toml, with the following contents:
[serviceweaver]
binary = "./hello"

[ssh]
listeners.hello = {address = "localhost:9000"}
locations = "./ssh_locations.txt"
The [serviceweaver] section of the config file specifies the compiled Service
Weaver binary. The [ssh] section contains the set of machines where your
application should be deployed, as well as per listener configuration. The set of
machines is specified as follows in ssh_locations.txt:
10.100.12.31
10.100.12.32
10.100.12.33
...
Deploy the application using weaver ssh deploy:
$ weaver ssh deploy weaver.toml
When weaver ssh deploy terminates (e.g., when you press ctrl+c), the
application is destroyed and all processes are terminated.
weaver ssh logs logs to stdout. Refer to weaver ssh logs --help for details.
Run weaver ssh dashboard to open a dashboard in a web browser. The
dashboard has a page for every Service Weaver application deployed via weaver ssh deploy.
Every deployment's page has a link to the deployment's metrics.
The metrics are exported in Prometheus format and looks something
like this:
# Metrics in Prometheus text format [1].
#
# To visualize and query the metrics, make sure Prometheus is installed on
# your local machine and then add the following stanza to your Prometheus yaml
# config file:
#
# scrape_configs:
# - job_name: 'prometheus-serviceweaver-scraper'
#   scrape_interval: 5s
#   metrics_path: /debug/serviceweaver/prometheus
#   static_configs:
#     - targets: ['127.0.0.1:43087']
#
# [1]: https://prometheus.io

# HELP example_count An example counter.
# TYPE example_count counter
example_count{serviceweaver_node="bbc9beb5"} 42
example_count{serviceweaver_node="00555c38"} 9001

# ┌─────────────────────────────────────┐
# │ SERVICEWEAVER AUTOGENERATED METRICS │
# └─────────────────────────────────────┘
# HELP serviceweaver_method_count Count of Service Weaver component method invocations
# TYPE serviceweaver_method_count counter
serviceweaver_method_count{caller="main",component="main.Example",serviceweaver_node="9fa07495",method="Foo"} 0
serviceweaver_method_count{caller="main",component="main.Example",serviceweaver_node="ee76816d",method="Foo"} 1
...
As the header explains, you can visualize and query the metrics by installing
Prometheus and configuring it, using the provided stanza, to periodically scrape
the /debug/serviceweaver/prometheus endpoint of the provided target
(127.0.0.1:43087 in the example above). You can also inspect the metrics
manually. The metrics page shows the latest value of every metric in your
application followed by the metrics that Service Weaver automatically creates
for you.
Run weaver ssh dashboard to open a dashboard in a web browser. The
dashboard has a page for every Service Weaver application deployed via weaver ssh deploy.
Every deployment's page has a link to the deployment's traces
accessible via Perfetto. This is similar to how you access the traces
when using the single process or the multiprocess deployer.
Refer to Perfetto UI Docs to learn more about how to use the tracing UI.
Note that the SSH deployer is not production ready yet, but rather it serves
as a playground to deploy a Service Weaver application on a set of machines. We
welcome contributions to make it production ready. Some limitations:
weaver ssh profile command not implemented.When you invoke a component's method, the arguments to the method (and the
results returned by the method) may be serialized and sent over the network.
Thus, a component's methods may only receive and return types that Service
Weaver knows how to serialize, types we call serializable. If a component
method receives or returns a type that isn't serializable, weaver generate
will raise an error during code generation time. The following types are
serializable:
int, bool, string) are serializable.*t is serializable if t is serializable.[N]t is serializable if t is serializable.[]t is serializable if t is serializable.map[k]v is serializable if k and v are serializable.t in type t u is serializable if it is not recursive and one
or more of the following are true:
t is a protocol buffer (i.e. *t implements proto.Message);t implements encoding.BinaryMarshaler and
encoding.BinaryUnmarshaler;u is serializable; oru is a struct type that embeds weaver.AutoMarshal (see below).The following types are not serializable:
chan t is not serializable.struct{...} is not serializable.func(...) is not serializable.interface{...} is not serializable.Note: Named struct types that don't implement proto.Message or
BinaryMarshaler and BinaryUnmarshaler are not serializable by default.
However, they can trivially be made serializable by embedding
weaver.AutoMarshal.
type Pair struct {
    weaver.AutoMarshal
    x, y int
}
The weaver.AutoMarshal embedding instructs weaver generate to generate
serialization methods for the struct. Note, however, that weaver.AutoMarshal
cannot magically make any type serializable. For example, weaver generate
will raise an error for the following code because the NotSerializable struct
is fundamentally not serializable.
// ERROR: NotSerializable cannot be made serializable.
type NotSerializable struct {
    weaver.AutoMarshal
    f func()   // functions are not serializable
    c chan int // chans are not serializable
}
Also note that weaver.AutoMarshal can not be embedded in generic structs.
// ERROR: Cannot embed weaver.AutoMarshal in a generic struct.
type Pair[A any] struct {
    weaver.AutoMarshal
    x A
    y A
}
To serialize generic structs, implement BinaryMarshaler and
BinaryUnmarshaler.
Service Weaver requires every component method to return an
error. If a non-nil error is returned, Service Weaver
by default transmits the textual representation of the error. Therefore any
custom information stored in the error value, or custom Is or As methods,
are not available to the caller.
Applications that need custom error information can embed a weaver.AutoMarshal
in their custom error type. Service Weaver will then serialize and deserialize
such errors properly and make them available to the caller.
weaver generate is Service Weaver's code generator. Before you compile and run a Service Weaver
application, you should run weaver generate to generate the code Service Weaver needs
to run an application. For example, weaver generate generates code to marshal
and unmarshal any types that may be sent over the network.
From the command line, weaver generate accepts a list of package paths. For
example, weaver generate . ./foo will generate code for the Service Weaver applications
in the current directory and in the ./foo directory. For every package, the
generated code is placed in a weaver_gen.go file in the package's directory.
Running weaver generate . ./foo, for example, will create ./weaver_gen.go
and ./foo/weaver_gen.go. You specify packages for weaver generate in the same
way you specify packages for go build, go test, go vet, etc. Run go help packages for more information.
While you can invoke weaver generate directly, we recommend that you instead
place a line of the following form in one of the .go files in the root of
your module:
//go:generate weaver generate ./...
Then, you can use the go generate command to generate all of
the weaver_gen.go files in your module.
Service Weaver config files are written in TOML and look something like this:
[serviceweaver]
name = "hello"
binary = "./hello"
args = ["these", "are", "command", "line", "arguments"]
env = ["PUT=your", "ENV=vars", "HERE="]
colocate = [
    ["main/Rock", "main/Paper", "main/Scissors"],
    ["github.com/example/sandy/PeanutButter", "github.com/example/sandy/Jelly"],
]
rollout = "1m"
A config file includes a [serviceweaver] section followed by a subset of the
following fields:
| Field | Required? | Description |
|---|---|---|
| name | optional | Name of the Service Weaver application. If absent, the name of the app is derived from the name of the binary. |
| binary | required | Compiled Service Weaver application. The binary path, if not absolute, should be relative to the directory that contains the config file. |
| args | optional | Command line arguments passed to the binary. |
| env | optional | Environment variables that are set before the binary executes. |
| colocate | optional | List of colocation groups. When two components in the same colocation group are deployed, they are deployed in the same OS process, where all method calls between them are performed as regular Go method calls. To avoid ambiguity, components must be prefixed by their full package path (e.g., github.com/example/sandy/). Note that the full package path of the main package in an executable is main. |
| rollout | optional | How long it will take to roll out a new version of the application. See the GKE Deployments section for more information on rollouts. |
A config file may additionally contain listener-specific and component-specific configuration sections. See the Component Config section for details.
Yes. While Service Weaver allows you to write your application as a single binary, a distributed deployer (e.g., multiprocess, gke), may place your components on separate processes/machines. This means that method calls between those components will be executed as remote procedure calls, resulting in possible network errors surfacing in your application.
To be safe, we recommend that you assume that all cross-component method calls involve a network, regardless of the actual component placement. If this is overly burdensome, you can explicitly place relevant components in the same colocation group, ensuring that they always run in the same OS process.
Note: Service Weaver guarantees that all system errors are surfaced to the
application code as weaver.RemoteCallError, which can be handled as described
in an earlier section.
Service Weaver primarily targets distributed serving systems. These are online systems that need to handle user requests as they arrive. A web application or an API server are serving systems, for example. Service Weaver tailors its feature set and runtime assumptions towards serving systems in the following ways:
In theory, you may be able to use Service Weaver for data-processing applications, though you will find that it provides little support for some of the common data-processing features such as checkpointing, failure recovery, restarts etc.
Additionally, Service Weaver's replication model means that component replicas
may automatically be scaled up and down depending on the load. This is likely
something that you wouldn't want in your data-processing application. This
scale-up/scale-down behavior translates even to the application's main()
function and may cause your data-processing program to run multiple times.
Different applications have different storage needs (e.g., global replication, performance, SQL/NoSQL). There are also a myriad of storage systems out there that make different tradeoffs along various dimensions (e.g., price, performance, API).
We didn't feel like we could provide enough value by inserting ourselves into the application's data model. We also didn't want to restrict how applications interact with their data (e.g., offline DB updates). For those reasons, we left the choice of data storage up to the application.
Yes, to a degree. If you use a globally reachable data storage system, then you can truly run your application anywhere, removing any portability concerns.
If, however, you run your storage system inside your deployment environment (e.g., a MySQL instance running in the Cloud VPN), then if you start your application in a different environment (e.g., your desktop), it may not have access to the storage system. In such cases, we generally recommend that you create different storage systems for different application environments, and use Service Weaver config files to point your application to the right storage system for the given execution environment.
If you're using SQL, Go's sql package helps isolate your code from some differences in the underlying storage systems. See the Service Weaver's chat application example for how to setup your application to use the environment-local storage systems.
As we described in the GKE versioning section, we utilize the combination of auto-scaling and blue/green deployment to minimize the cost of running multiple versions of the same application during rollouts.
In general, it is up to the deployer implementation to ensure that the rollout cost is minimized. We envision that most cloud deployers will use a similar technique to GKE to minimize their rollout costs. Other deployers may choose to simply run full per-version serving trees, like the multiprocess deployer.
No. We acknowledge that there are still valid reasons why developers may choose to run separate binaries for different microservices (e.g., different teams controlling their own binaries). We believe, however, that Service Weaver's modular monolith model is applicable to a lot of common use-cases and can be used in conjunction with the traditional microservices model.
For example, a team may decide to unify all of the services in their control into a single Service Weaver application. Cross-team interactions will still be handled in the traditional model, with all of the versioning and development implications that come with that model.
Service Weaver is trying to encourage a modular monolith model, where the application is written as a single modularized binary that runs as separate microservices. This is different from the monolith model, where the binary runs as a single (replicated) service.
We believe that the Service Weaver's modular monolith model has the best of both worlds: the ease of development of monolithic applications, with the runtime benefits of microservices.